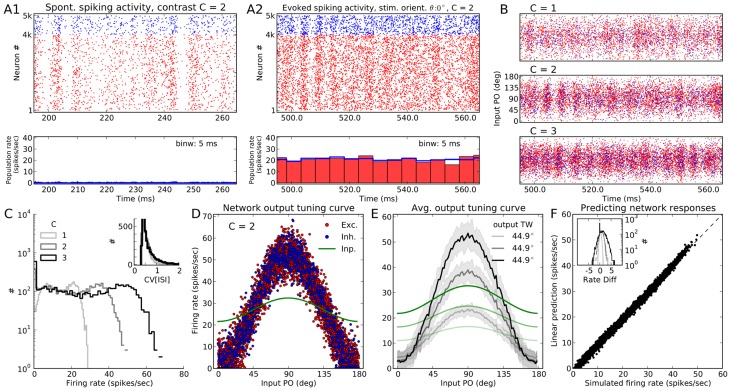
Figure 1. Neuronal responses in a network of PIF neurons to an oriented stimulus.
(A) Spontaneous activity (A1) and evoked response of a PIF network to a stimulus of orientation  (A2) at a medium contrast,
  . Evoked activity is the response of the network to the full external input (comprising the stimulus-independent background and the stimulus-induced feedforward input), whereas spontaneous activity of the network is the response to the background input only (for details, see Methods, Sect. Simulation of networks of spiking neurons and Eq. (1)). The network was arranged to have relatively weak recurrent inhibition,
  . The spiking activity of the full network is shown for
  out of the full
  of stimulation. At the bottom, temporal population rates, computed in bins of size
  , are shown for excitatory and inhibitory populations separately. Here and in the remaining text, unless otherwise stated, the colors red and blue are used to represent excitatory and inhibitory neurons, respectively. (B) Similar raster plot as in (A), top, for three different stimulus contrasts. However, neurons are now sorted according to the preferred orientation of their input (input PO). (C) Distribution of average firing rates estimated over
  , for different contrasts. Inset: Coefficient of variation (
 ) is computed from inter-spike intervals (ISI) of all neurons that emitted more than
  spikes during
  of stimulation at each contrast, respectively. (D) Average firing rate of neurons are plotted vs. their input PO, at the medium contrast (
 ). The feedforward (stimulus-induced) input to the network is normalized to the mean (over neurons) firing rate of the network and plotted in green for comparison. Exc.: Excitatory, Inh.: Inhibitory, Inp.: Input. (E) The mean (solid line) and STD (shading) of the population tuning curves, at each contrast. The range of input POs is broken into
  bins, and mean and STD are then computed from all neurons falling into the same bin. The average output tuning width (TW) at each contrast is computed from the von Mises function best-fitting to the mean output tuning curve (see Methods for details). The input to the network has a cosine tuning (
 ), so any output TW less than this value implies a sharpening of the network tuning curves. The normalized feedforward input at each contrast is also plotted in green, similar to (D). (F) For each neuron in the network, prediction of the linear theory (Eq. (14)), is plotted vs. the firing rate obtained from the simulation at the medium contrast. The distributions of the difference between the actual and the predicted firing rates (rate diff) at this orientation are shown in the inset for all three contrasts, respectively.

