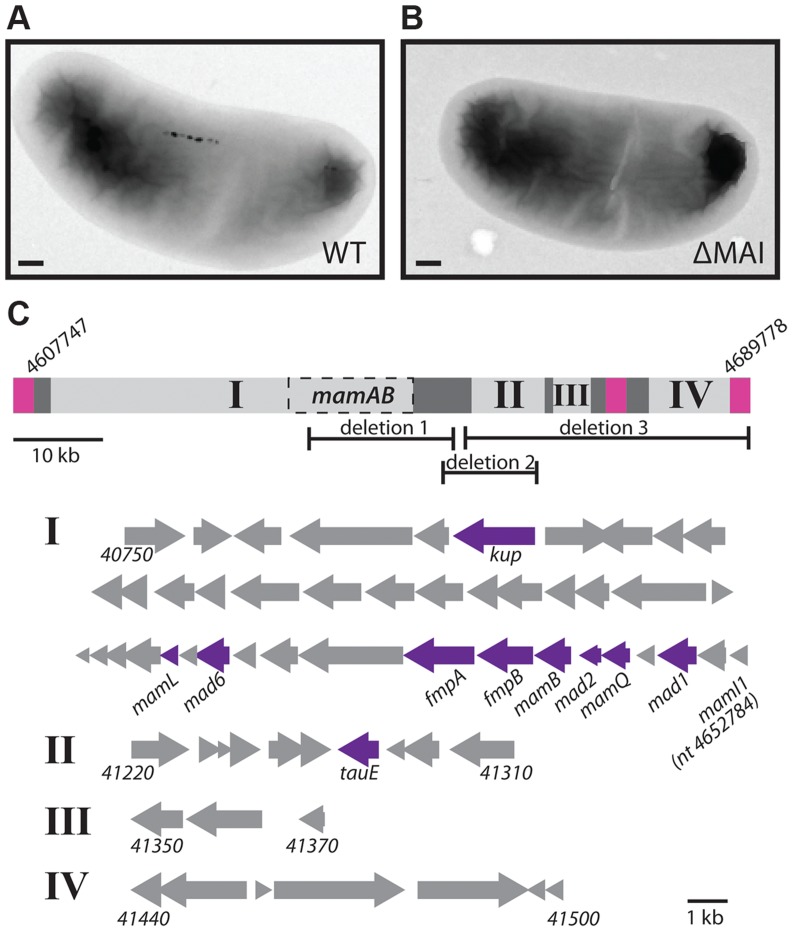
Figure 3. The RS-1 MAI.
TEM of WT (A) and MAI deletion (B) cells. Scale bar 200 nm. C) Depiction of groups I, II, III, and IV of the MAI. Pink squares represent the repeats surrounding the island. Dark grey represents areas of transposons and repeats. Dashed box labeled MamAB is the region detailed in figure 1C. The nucleotide positions of the beginning and end of the island are indicated. The areas of the island missing in deletions 1, 2, and 3 are also shown. Below, the genes that make up groups I, II, III, and IV are represented by arrows, with the beginning and ending gene names indicated for each group. The ending nucleotide position is given in the case of mamI1, which is not assigned a gene number. Genes that were hit in the screen are indicated in purple.

