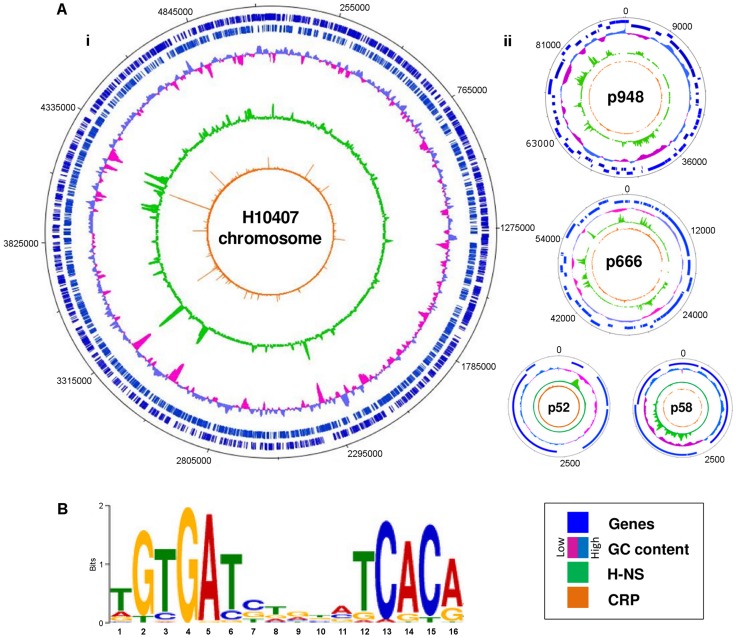
Figure 1. Distribution of CRP and H-NS across the ETEC H10407 genome.
A) The panel shows maps of the ETEC H10407 chromosome (i) and associated plasmids (ii). In each plot, tracks 1 and 2 (blue lines) show the position of genes, track 3 (purple and cyan graph) is a plot of DNA GC content, track 4 (green) is the H-NS binding profile and track 5 (orange) is the CRP binding profile. B) A DNA sequence motif generated by aligning regions of the ETEC H10407 chromosome bound by CRP.

