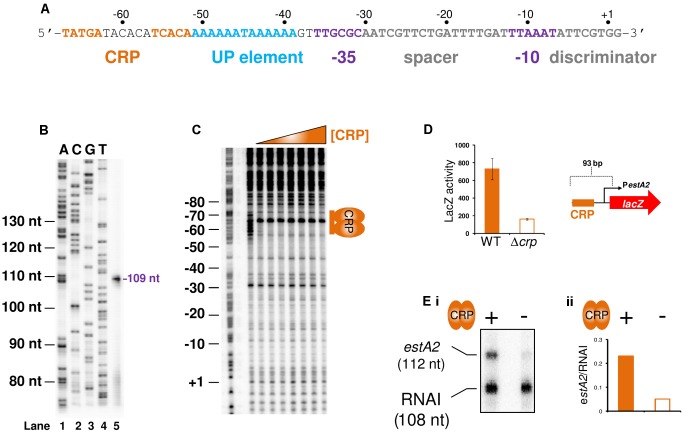
Figure 3. The estA2 promoter is activated by a Class I CRP dependent mechanism.
A) Sequence of the estA2 gene regulatory region. The CRP binding site is shown in orange, the UP element is blue and the promoter -10 and -35 elements are shown in purple. The different promoter positions are numbered relative to the transcription start site (+1). B) Location of the PestA2 transcription start site. The gel shows the product of an mRNA primer extension analysis to determine the estA2 transcription start site (Lane 5). The gel was calibrated using arbitrary size standards (A, C, G and T in Lanes 1–4). C) Binding of CRP to PestA2. The panel shows the result of a DNAse I footprint to monitor binding of CRP to the 93 bp PestA2 DNA fragment. The gel is calibrated with a Maxim-Gilbert DNA sequencing reaction. CRP was added at concentrations of 0.35–2.1 µM. D) CRP is required for transcription from PestA2 in vivo. The panel shows a cartoon representation of the 93 bp PestA2::lacZ fusion and a bar chart illustrates LacZ activity in lysates of cells carrying this fusion. Assays were done in LB medium. E) i) Stimulation of PestA2 by CRP in vitro. The figure shows the results of an in vitro transcription reaction. The 112 nt transcript initiates from PestA2 and the 108 nt RNAI transcript is an internal control. CRP was added at a concentration of 350 nM and RNA polymerase was added at a concentration of 400 nM. ii) quantification of band intensities from the in vitro transcription analysis.

