
Figure 6. The eltAB promoter is indirectly repressed by CRP.
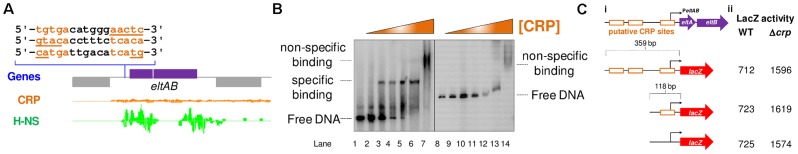
A) The Panel shows ChIP-seq data for CRP and H-NS binding at the eltAB locus. The sequence of 3 putative CRP binding sites proposed by Bodero and Munson (2009) are shown. The CRP and H-NS binding profiles are plots of sequence read counts at each position of the genome on both the top (above the central line) and bottom (below the central line) strand of the DNA. The y-axis scale for H-NS binding is 1,785 reads on each strand and for CRP binding is 14,000 reads on each strand. B) Results of an Electorphoretic Mobility Shift Assay to measure binding of CRP to the 93 bp PestA2 fragment (Lanes 1–7) or the 359 bp PeltAB fragment (Lanes 8–14). Specific and non-specific binding of CRP is indicated to the left and right of the gel. CRP was added at a concentration of 0.2–7.0 µM. C) Panel (i) shows different PeltAB::lacZ fusions. The lacZ gene is shown as a red arrow and the eltAB operon is shown in purple. PeltAB is illustrated using a bent arrow and the putative CRP binding sites are shown as open orange boxes. In panel (ii) the values are β-galactsidase activity measurements taken in M182 or the Δcrp derivative. Assays were done in LB medium.