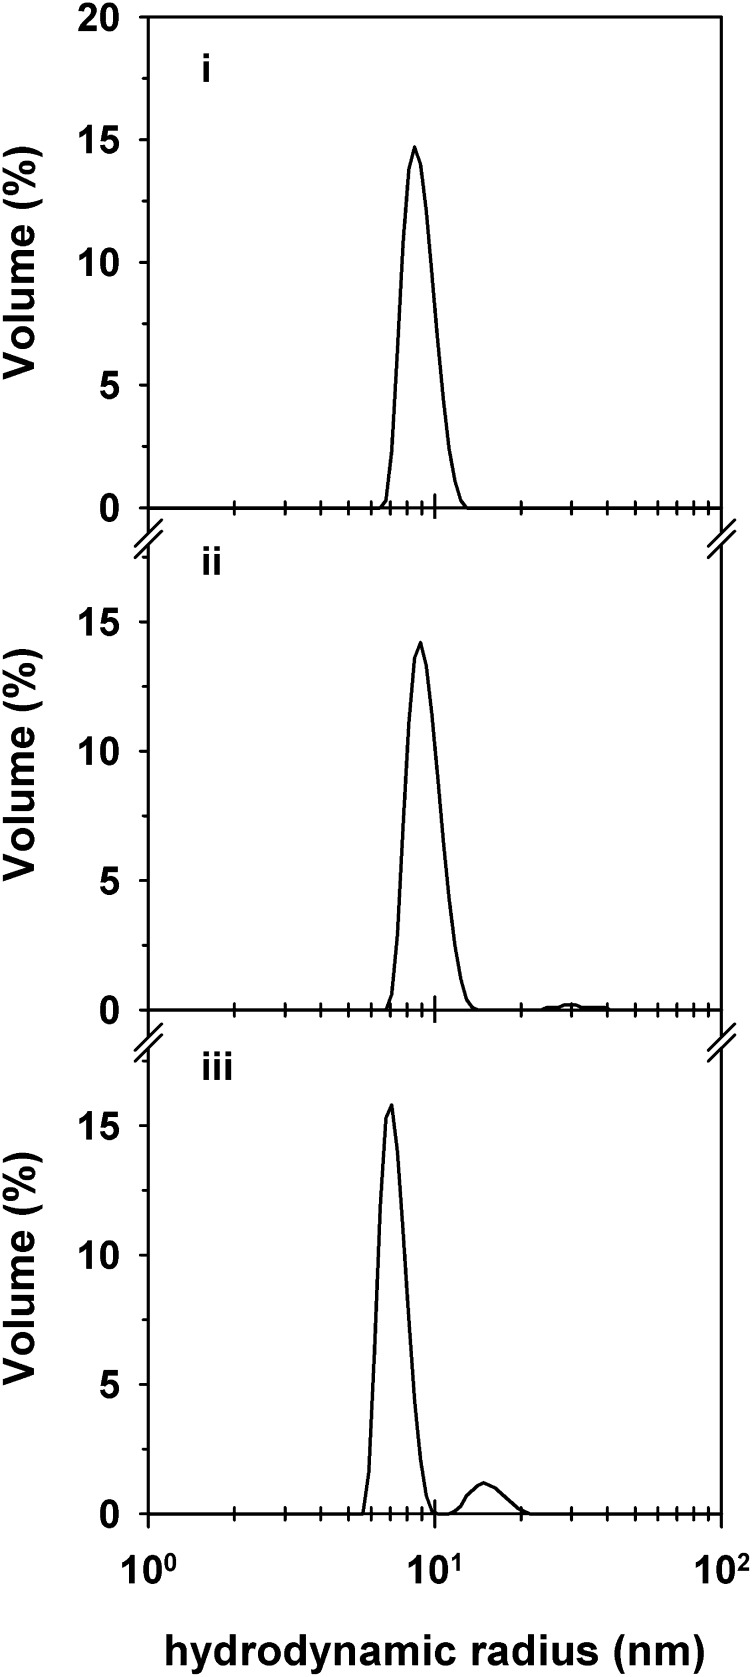
Figure 6.
Size distribution profile of the VAR2CSA ectodomain in the presence and absence of CSA in solution. The size distribution by volume of purified VAR2CSA ectodomain (250 µg mL−1) in the absence (i) and in the presence of 130 µg/mL CSA (ii) or 320 µg mL−1 CSA (iii). Note the shift in the hydrodynamic radius of the VAR2CSA ectodomain in the presence of CSA and the appearance of a minor population with a hydrodynamic radius twice that of the major population. CSA is not detectable at the concentrations employed in this study. A representative example of 3 biological replicates is shown.

