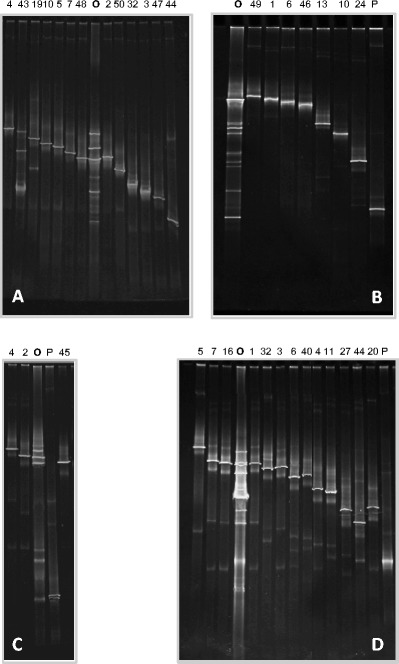
Fig. 3.

PCR-DGGE-fingerprints derived from a the bacterial community colonizing all three pooled swab samples and b the fungal communities colonizing the swab sample AP1, c the swab sample AP2, and d the swab sample AP3 of the Archimedes Palimpsest, as well as the PCR-DGGE profiles of sequenced clones containing 16S rDNA bacterial fragments (a) and ITS regions (b–d) producing PCR products with different motility behavior. O Original fingerprint derived from swab samples. P clones matching plant DNA. The numbers of the lanes indicate the number of the corresponding sequenced clones quoted in Table 1 and 2. The linear chemical gradient of denaturants used was 25–60 % for bacteria and 20–50 % for fungi
