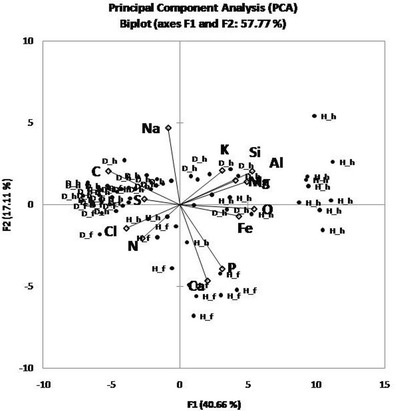
Fig. 8.

PCA analysis plot of the first two components (57.77 % of the total variation). The variables used were the chemical elements obtained from the parchment core samples by means of EDS analysis (C, N, O, Ca, Si, Al, Cl, Na, S, P, Mg, and Fe). H_h healthy hair side, H_f healthy flesh side, D_h damaged hair side, D_f damaged flesh side
