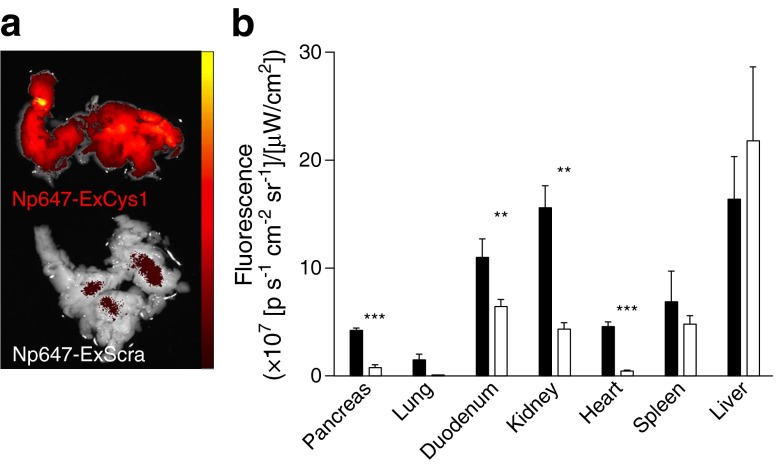
Fig. 2.
(a) Ex vivo fluorescence images of pancreas, 24 h after the intravenous injection of either Np647–ExCys1 or Np647–ExScra. (b) Semi-quantitative analysis of fluorescence 24 h after the intravenous injection of either Np647–ExCys1 (black bars) or Np647–ExScra (white bars). Data are mean + SEM (n = 3 mice per condition). **p < 0.01 and ***p < 0.001 vs Np647–ExCys1

