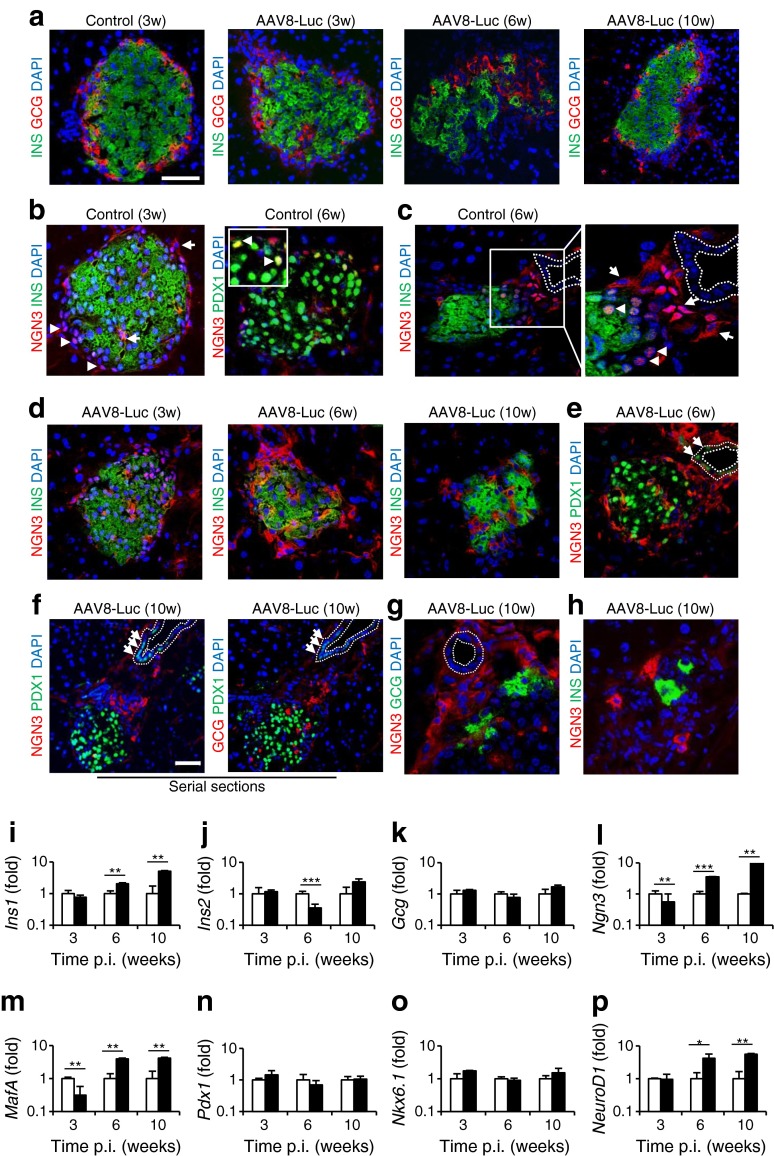
Fig. 4.
Displacement of glucagon-positive cells and activation of NGN3-positive cells following immunological beta cell damage. (a) The location of insulin (INS)-positive and glucagon (GCG)-positive cells was determined by staining control and immunologically damaged islets with anti-insulin (green) and anti-glucagon (red) antibodies at 3, 6 and 10 weeks p.i. (b) NGN3 expression was detected using an anti-NGN3 antibody in age-matched control islets at 3 and 6 weeks p.i.. Note cytoplasmic (arrows) and nuclear localisation (arrowheads) in normal islets. (c) Immunostaining demonstrated both nuclear (arrowheads) and cytoplasmic (arrow) NGN3 expression in age-matched control islets near ducts. (d) NGN3 expression was analysed in islets from AAV8-Luc-transduced mice at 3, 6 and 10 weeks p.i. Insulin expression was detected using an anti-insulin antibody. (e) Islets from AAV8-Luc-transduced mice at 6 weeks p.i. were analysed for NGN3 and PDX1 (green) expression. Note induction of PDX1 expression in ductal lining cells (arrows). (f) Representative islets showing NGN3, PDX1 and glucagon localisation after immune response. Nuclear PDX1-positive cells (arrows) were identified in ductal lining cells. (g) Immunostaining of the region between recovering islets and ducts with anti-NGN3 and glucagon antibodies. (h) A representative image of single insulin-positive cells (green) identified at 10 weeks p.i. is shown with anti-NGN3 co-staining (red). (a–h) Dashed lines correspond to ductal epithelium. Scale bars, 50 μm; w, weeks. (i–p) Quantitative RT-PCR analysis of pancreatic transcripts for common islet- and beta cell-associated factors. Results show AAV8-Luc transcripts (black bars) relative to age-matched control (white bars) pancreas, set as 1; logarithmic scale, base 10. Data are presented as means ± SEM, representing four mice per group per time point. *p < 0.05, **p < 0.01, ***p < 0.001; INS, insulin

