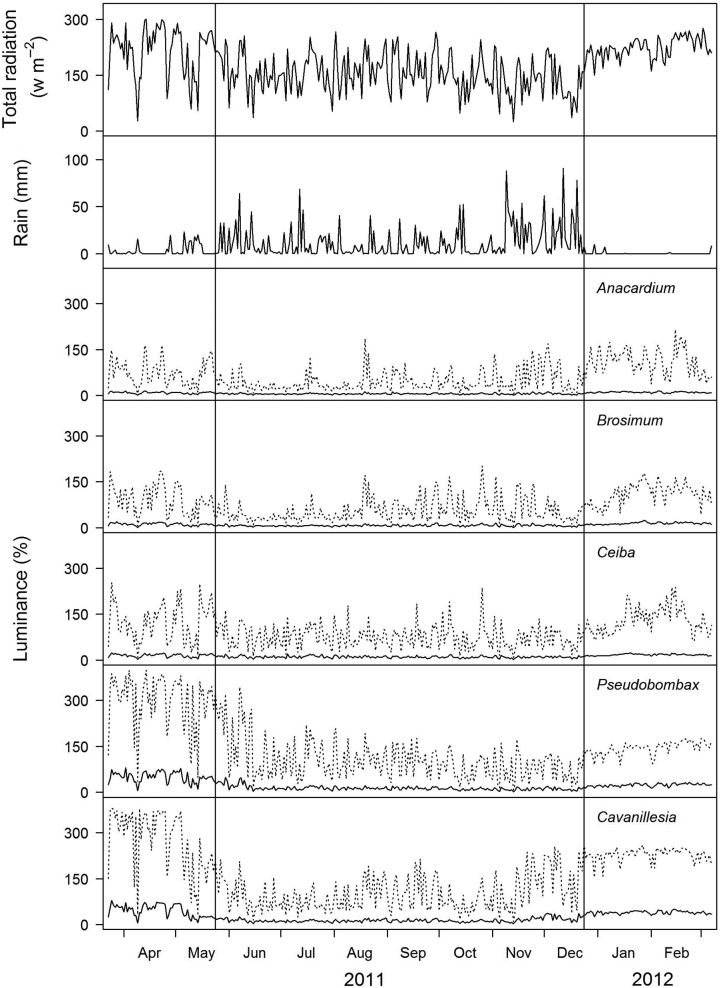
Figure 2.
Seasonal changes in radiation and rainfall. Data for radiation and rain data were obtained from the Physical Monitoring Program of STRI. Light is presented as daily mean, while rain represents daily integrals. Daily means (solid line) of total radiation in percentage of the highest daily mean measured in the tree crowns of the five species studied (A. excelsum, n = 4 trees; B. alicastrum, n = 4; C. pentandra, n = 4; P. septenatum, n = 3; C. platanifolia, n = 4) over the course of 1 year. The dotted lines depict the mean daily maximum. The vertical lines mark the limits of dry and wet seasons (see MM for definition).

