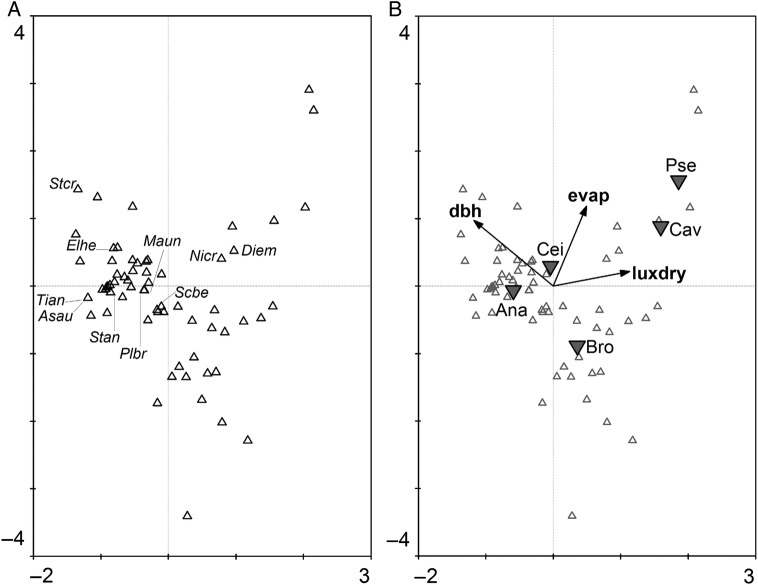
Figure 4.
Species-conditional triplot (divided into two graphs for easy interpretation) based on a canonical correspondence analysis of the log-transformed epiphyte species abundance data (rare species were down-weighted) displaying 18 % of the inertia (=weighted variance) in the abundances and 84 % of variance in the weighted averages and class totals of species with respect to environmental variables. The eigenvalues of Axis 1 (horizontally) and Axis 2 (vertically) are 0.26 and 0.15, respectively. Displayed are species (small triangles) and tree centroids (down triangles). Quantitative environmental variables are indicated by arrows in (B) (dbh of trees, evaporation and luminance measured in dry season). In the analysis 79 true epiphyte species were included; only the 10 most abundant species are labelled in (A). Epiphyte species names are abbreviated with the first two letters of the genus and epitheton: Asplenium auritum, Dimerandra emarginata, Elaphoglossum herminieri, Maxillaria uncata, Niphidium crassifolium, Pleurothallis brighamii, Scaphyglottis behrii, Stenospermation angustifolium, Stelis crescentiicola and Tillandsia anceps. Tree species are: A. excelsum, B. alicastrum, C. pentandra, P. septenatum and C. platanifolia.

