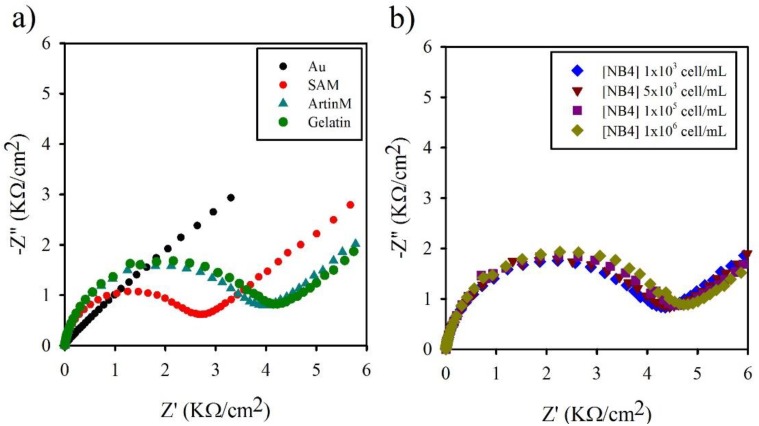
Figure 2.
Determination of the ArtinM–NB4 interaction by EIS. Nyquist plots of impedance spectra were constructed by formation of the SAM, the immobilization of ArtinM, and blocking with gelatin (a), and by addition of different concentrations of NB4 cells (b). The impedance spectra were recorded in the presence of 1 mmol/L [Fe(CN)6]3−/4− as the redox probe in a KNO3 1 mol/L as a supporting electrolyte, and were conducted in a frequency range of 0.01 Hz to 1 MHz, in the fixed potential of ~0.22 V vs. Ag|AgCl, and at an amplitude of 10 mV. Z'' is the imaginary and Z' is the real part of impedance. was measured from approximation of the diameter of the semi-circle of real part of impedance, Z'.

