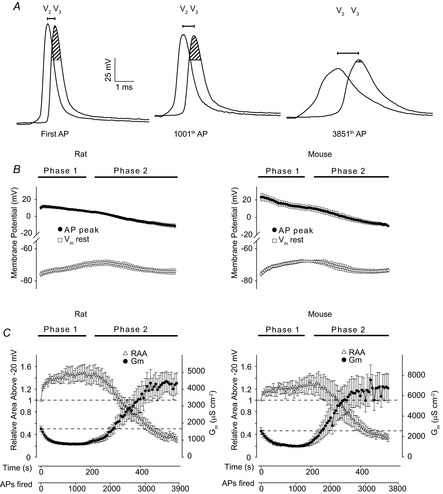
Figure 4. Analysis of action potential waveform and resting membrane potential during activity in rat and mouse fibres.

A shows overlays of V2 and V3 recordings of the first action potential in the first (First AP), 20th (1001th AP) and the 78th (3851th AP) run of current injections in a representative rat EDL fibre. The shaded area in the V3 recording indicates the part of the action potential waveform above −20 mV. B, action potential peak (AP peak) and resting membrane potential (Vm rest) measured by V3 during the experiments using rat (n = 14) and mouse (n = 7) EDL fibres. C shows the changes in relative waveform area above −20 mV (RAA) of the first action potential recorded by V3 in each run during the experiments as illustrated in A, together with the calculated Gm. n = 7 or 14 (mouse and rat, respectively). Plots in B and C have been shown on the same time axis displayed below C. Average data shown as mean ± SEM.
