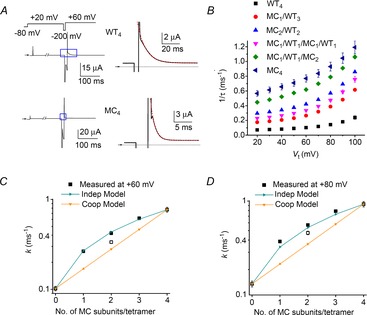
Figure 8. Independent M645C subunit interactions mediate accelerated rate of hERG1 inactivation.

A, triple pulse voltage clamp protocol and corresponding currents recorded from oocytes expressing WT4 or MC4 hERG1 channels. Left panels show currents recorded in response to the indicated voltage steps. The first pulse was 1 s in duration and the second was 5 ms in duration for WT4 and 3.5 ms for MC4 channels. Expanded view of area designated by blue box is shown in right-hand panels. Inactivating current elicited during third pulse to +60 mV was fitted with a single exponential function (dotted red curves) to estimate τinact. B, plot of 1/τinact as a function of voltage for indicated concatenated tetramers (n = 4–10). C and D, estimated forward rate constants for inactivation (k) and k predicted by indicated models are plotted as a function of the number of M645C subunits in a concatenated tetramer at +60 mV (C) and +80 mV (D). Open square represents MC1/WT1/MC1/WT1 channels.
