
Figure 1. CB sensory activity during prolonged exposure to glucose deprivation.
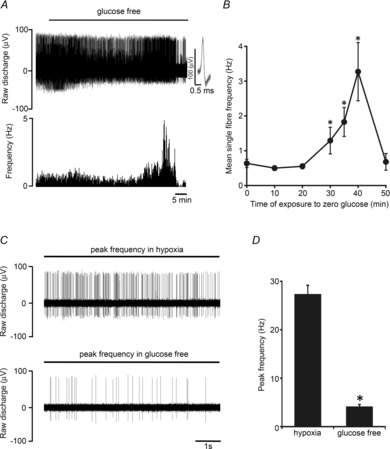
A, example trace demonstrating the impact of prolonged glucose deprivation on the neuronal output of the intact CB. Basal discharge is maintained for at least 20 min before brief stimulation and then irreversible decline. Raw discharge is shown (upper) along with single fibre frequency (lower). Overdrawn action potentials portraying single fibre discrimination are shown in the inset. B, mean discharge frequencies calculated at progressive time points during exposure to glucose deprivation. Error bars indicate ± SEM; *P < 0.05 compared with basal frequency; one-way repeated-measures ANOVA with Dunnett's post hoc comparisons test (n = 8 fibres from 8 CB preparations). C, example of the raw neuronal discharge taken from the same single fibre showing a 10 s period of maximal hypoxic (upper) and glucose-free (lower) stimulation. D, grouped data demonstrating that stimulation in response to glucose deprivation is significantly smaller than that induced by hypoxia. Error bars indicate + SEM. *P < 0.05 compared with hypoxia; paired t test (n = 12 fibres from 8 CB preparations).