
Figure 2. The time to a response in glucose deprivation is dependent on  -mediated, basal neuronal firing frequency.
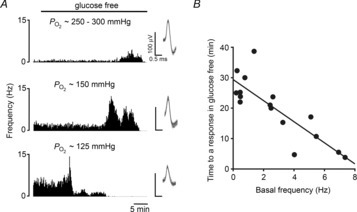
A, example traces showing the sensory neuronal responses to glucose deprivation with increasing initial basal discharge frequencies (upper to lower). Moderate neuronal stimulation was induced by lowering and maintaining the superfusate  . Single fibre raw discharge was recorded and expressed in frequency histograms. For each trace multiple action potentials have been overdrawn to show the single fibre discrimination. B, grouped data showing a correlation between basal frequency and the time taken to respond to glucose deprivation (R2 = 0.7, P < 0.05; linear regression analysis; n = 16 fibres from 13 CB preparations).