
Figure 3. Glycogen granules and glycogen conversion enzymes are present in the rat CB.
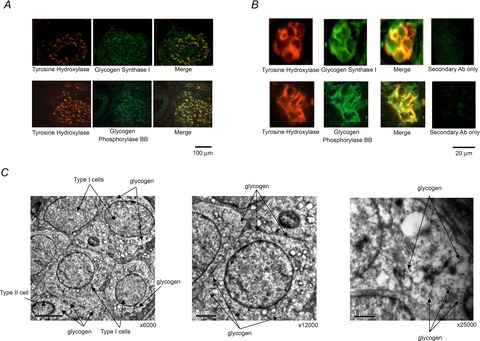
A, immunofluorescence staining of CB tissue sections showing co-localisation of tyrosine hydroxylase (TH; type I cell marker) with glycogen synthase I and neuronal glycogen phosphorylase (BB) in the type I cells, across the entire CB (scale bar = 100 μm). Staining was consistent across sections from three different CBs. B, higher magnification fluorescence images of two different type I cell clusters, demonstrating co-localisation of TH with glycogen synthase I and neuronal glycogen phosphorylase (BB), specifically in the type I cell cytoplasm. There is also a degree of staining detected outside of type I cells for both glycogen conversion enzymes. Scale bar = 20 μm. C, electron micrographs showing glycogen granules in the cytoplasm of multiple type I cells and in a neighbouring type II cell, within a single cluster. The higher magnification micrographs are of type I cells (middle and right). Scale bars = 5 μm (left), 2 μm (middle) and 1 μm (right).