
Figure 4. Antioxidant treatment does not prevent catabolic systems induction and atrophy in the early phases of HU.
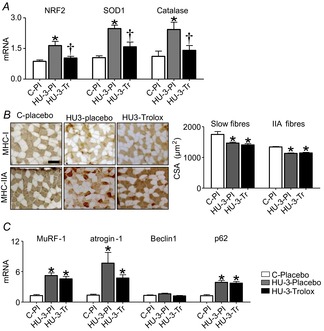
A, quantification of mRNA levels of NRF2, SOD1 and catalase by real-time PCR. B, Cross-cryosections of soleus muscles using anti-MHC-I (BA-F8) and anti-MHC-IIA (SC-71) monoclonal antibodies and relative CSA measurements. C, quantification of mRNA of MuRF-1, atrogin-1 (ubiquitin proteasome system), Beclin1 and p62 (autophagy system) by real-time PCR. C-Pl, placebo control; HU-3-Pl, placebo 3 days of hindlimb unloading; HU-3-Tr, Trolox 3 days of hindlimb unloading. *Significantly different from C-placebo (P < 0.05); †significantly different from HU-3-Pl (P < 0.05). Data are presented as means ± SEM.