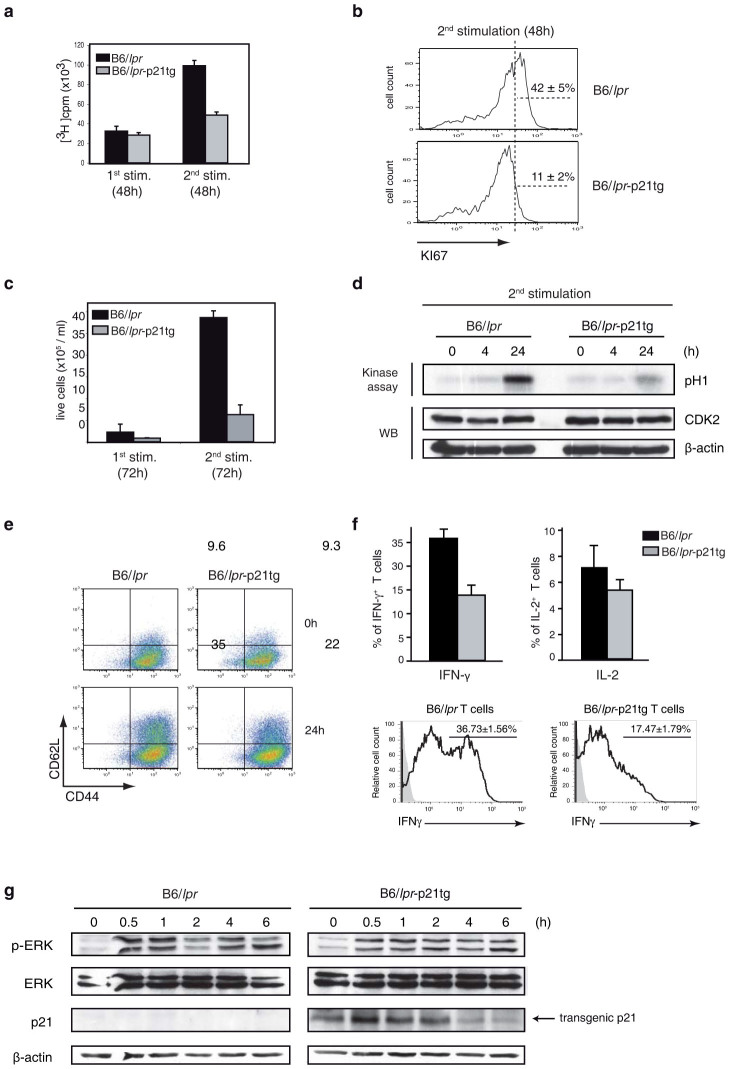
Figure 6. p21 overexpression decreases in vitro B6/lpr T cell hyperproliferation after secondary stimulation.
CD4+ T cells from B6/lpr and B6/lpr-p21tg mouse spleens were ConA-stimulated (1st stimulation) and -restimulated (2nd stimulation) after the IL-2 expansion phase. (a) Transgenic p21 reduced T cell responses only after restimulation. Proliferation was measured by [3H]thymidine uptake 48 h after ConA stimulation or restimulation. Values show mean ± SD from one representative experiment (n = 4 T cell preparations from distinct mice; p < 4 × 10⁻⁶) of four performed. (b) Flow cytometry showed reduced expression of the Ki-67 proliferation marker in B6/lpr-p21tg compared to B6/lpr T cells after restimulation. Data from one representative experiment of three performed. (c) Absolute numbers of B6/lpr-p21tg T cells generated after restimulation were decreased compared to B6/lpr T cells. Live cells were determined by trypan blue exclusion. Values show mean ± SD from one representative experiment of three performed (n = 4 T cell preparations from distinct mice; p < 10−7). (d) CDK2 activity after ConA restimulation. Assay products were resolved in SDS-PAGE and phosphorylated histone (H1) was detected by autoradiography. Extracts were analyzed by Western blot for CDK2 levels as loading control. (e) Similar percentages of B6/lpr and B6/lpr-p21tg CD44highCD62Lhigh CD4+ T cells at the end of the IL-2 expansion (top). At 24 h after restimulation, the percentage of B6/lpr-p21tg CD44highCD62Lhigh cells was decreased compared to B6/lpr (bottom). (f) Flow cytometry of CD4+ T cells for intracellular cytokines. IFN-γ-producing B6/lpr-p21tg CD4+ T cells were reduced compared to B6/lpr 24 h after restimulation. Values show mean ± SD (n = 4 mice each; p < 10−2). Differences in IL-2 were not significant (top). After restimulation with IL-2, IL-12 and IL-18, IFN-γ-producing B6/lpr-p21tg were lower compared to B6/lpr T cells. Values show mean ± SD (n = 3 mice, p = 0.0013) (bottom). (g) Western blot showing ERK phosphorylation and transgenic p21 protein levels in B6/lpr and B6/lpr-p21tg T cells after restimulation. β-actin was used as a loading control. The samples were derived from the same experiment and the two gels were run and processed simultaneously under the same experimental conditions.

