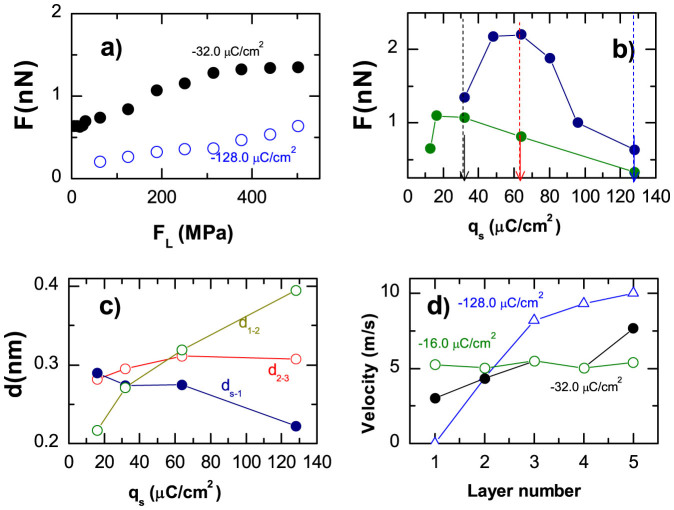
Figure 3. Rationalizing friction between equally charged surfaces.
(a) Loading effect on friction shown for two indicated surface charge densities, qs = −32 μC/cm2 and qs = −128 μC/cm2. (b) Nonmonotonic charge dependencies of the friction force, shown for two loads, FL: 188 MPa (green curve) and 500 MPa (blue curve). (c) Charge dependence of the mean distances between the wall and the first layer (blue curve), the first and second layers (green curve) and the second and third layers (red curve). (d) Velocity profiles inside the IL film for three values of surface charge density qs : −16 μC/cm2 (open circles), −32 μC/cm2 (filled circles) and −128 μC/cm2 (triangles); shown for FL = 188 MPa.

