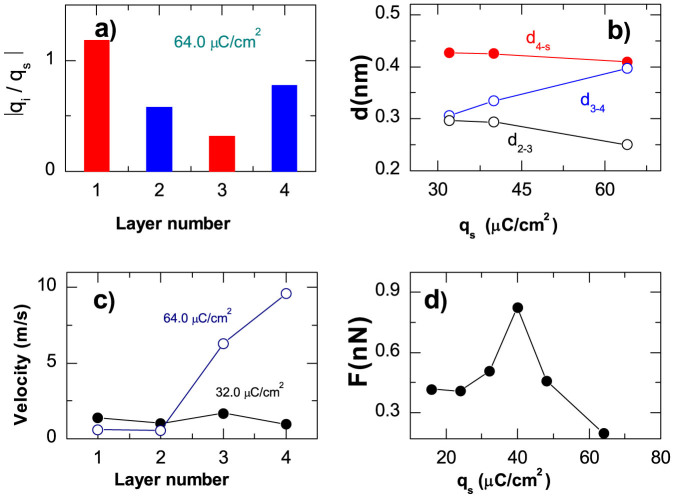
Figure 5. Rationalizing friction between oppositely charged surfaces.
(a) Charge densities in cation (red)- and anion (blue)-rich layers normalized by the surfaces charge density, qs. (b) Charge dependence of the mean distances between the wall and the forth layer, d4-S (red curve), between the fourth and third layers d3–4 (blue curve) and between the third and second layers, d3-2 (black curve). (c) Velocity profiles inside the IL film for the indicated values of qs. (d) Charge dependencies of the friction force shown at load FL = 188 MPa.

