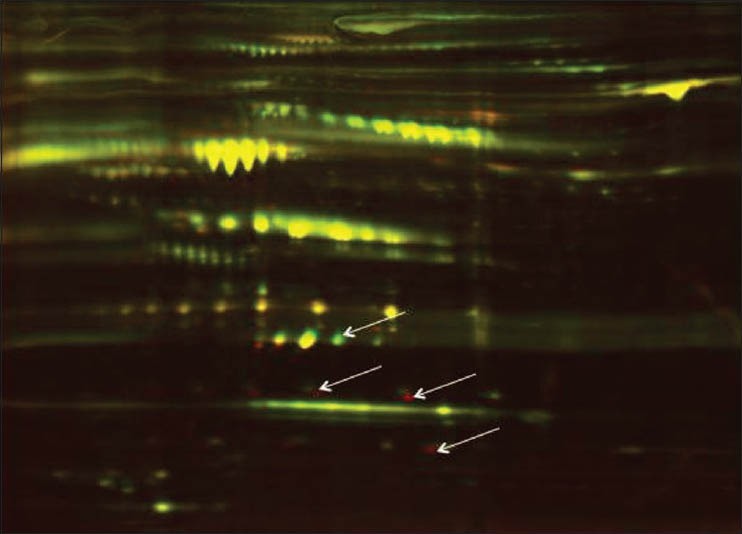
Figure 1.

2D-DIGE analysis of control and GDM maternal serum. Pooled samples were first adsorbed on multi-lectin columns to purify the total glycoprotein fraction, this fraction was then eluted and subjected to 2- D DIGE. Differentially abundant proteins (arrows) appear as red or green spots depending on the extent of under- or over-abundance
