
Figure 5.
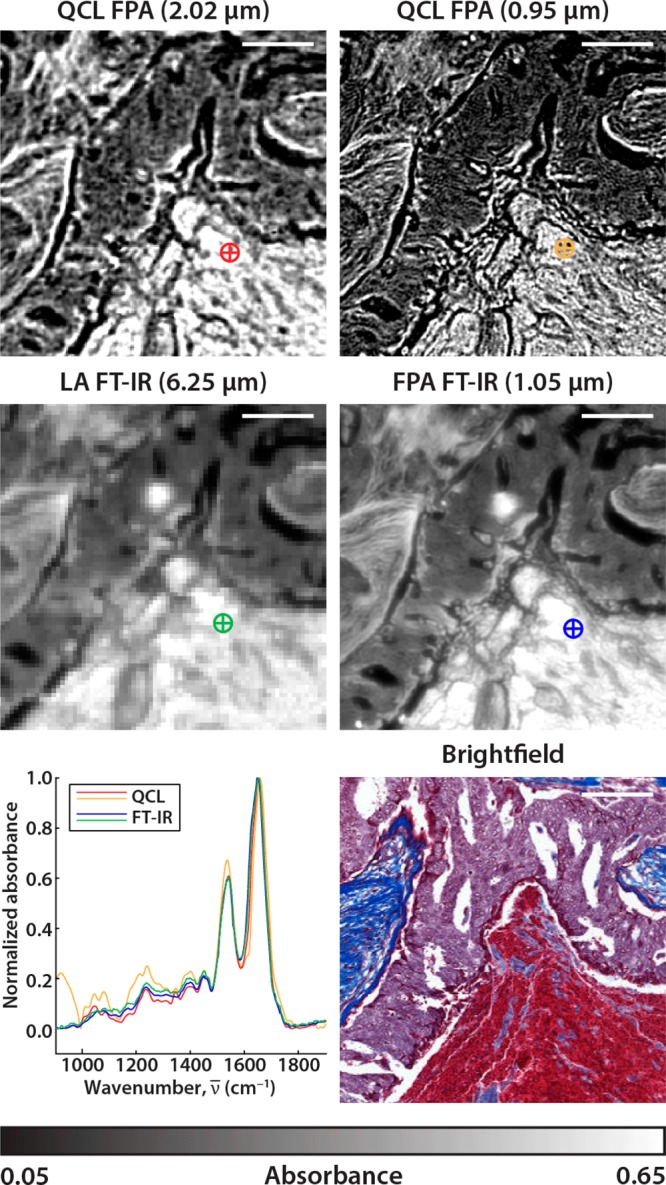
Images corresponding to the amide I absorption band at 1656 cm–1 from the C2 tissue core on the BRC1501 TMA are acquired by QCL and FT-IR instruments. A brightfield microscopy image of a Masson’s trichrome-stained serial section from the same core is included. The 4 cm–1 resolution fingerprint region spectra from a single pixel, baseline corrected and normalized to the amide I band at the marked location on the images are compared between each system. The scale bars represent 100 μm.