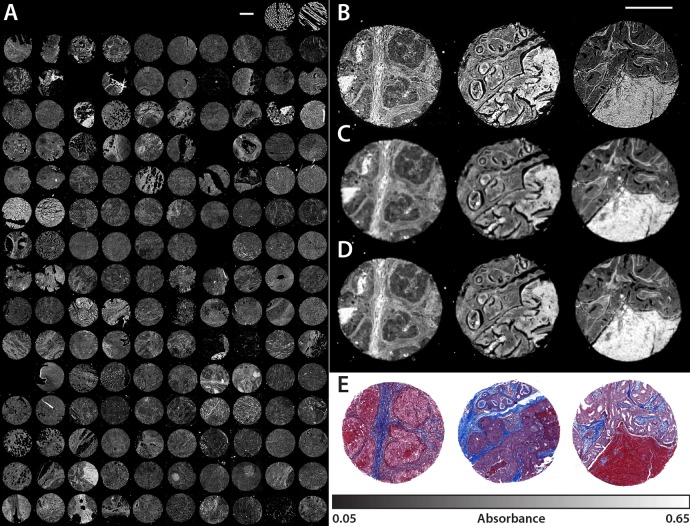
Figure 6.
(A) Absorbance data of 148 tissue cores from the BRC1501 TMA acquired by the QCL microscope with the 0.56 NA (2.02 μm) objective. The net scan time of the fingerprint ranging from 776.9 to 1904.4 cm–1 at 4 cm–1 resolution was approximately 5 h. Only the amide I absorbance band at 1656 cm–1 from the full spectral data set is displayed. Selected tissue cores (C2, C7, G5) are also imaged by the (B) QCL with the 0.85 NA (0.95 μm) objective, (C) LA FT-IR (6.25 μm), and (D) FPA FT-IR (1.05 μm). (E) A brightfield image of a serial core section treated with Masson’s trichrome stain as performed in traditional histological studies. The scale bars in all images represent 500 μm.

