
Figure 6. CaMKII mediates infiltration o CD45+ cells and pro-inflammatory chemoattractant signaling.
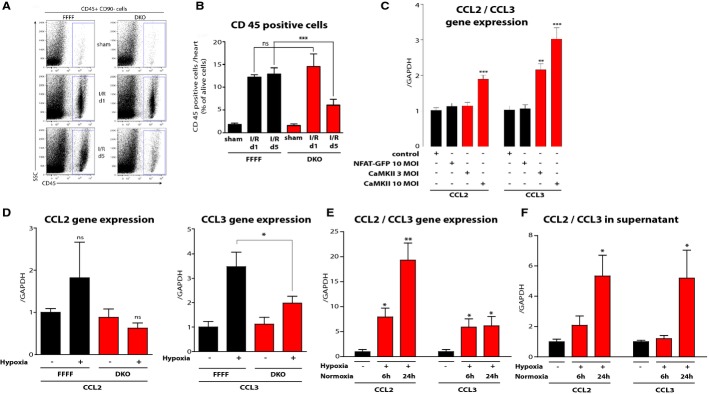
- Representative dot plots of hearts analyzed by flow cytometry comparing sham operated, I/R d1 and I/R d5 from DKO and FFFF control animals. Blue gates indicate CD45+ cells.N = 5 animals per sham group, 6 animals per I/R group.
- Quantitative analysis. Reduced infiltration of CD45+ leukocytes occurs 5 days after I/R injury in DKO mice, while no significant differences can be detected on day 1 after I/R injury. ns,P = 0.86; ***P = 0.0004.
- Gene expression as determined by real-time RT–PCR of CCL2 and CCL3 in NRVMs under control conditions and after adenoviral infection with active CaMKII (contains T287D mutation for auto-activation) or NFAT-GFP as additional control. Gene expression is normalized to GAPDH.N = 6 independent experiments per group. ***P = 0.0001 in CCL2 group; **P = 0.002; ***P = 0.0001 in CCL3 group.
- Gene expression as determined by real-time RT–PCR of CCL2 and CCL3 in adult mouse ventricular myocytes (AMVMs) from FFFF and DKO mice (n = 6 wells per condition) after hypoxia, normalized to GAPDH. ns,P = 0.68 in FFFF group; ns,P = 0.29 in DKO group; *P = 0.01.
- Gene expression as determined by real-time RT–PCR of CCL2 and CCL3 in NRVMs after hypoxia followed by normoxia periods as indicated, normalized to GAPDH, respectively.N = 4 wells per condition. *P = 0.02; **P = 0.006 in CCL2 group; *P = 0.01 (6 h); *P = 0.02 (24 h) in CCL3 group.
- Quantification of CCL2 and CCL3 protein as determined by ELISA in supernatant from NRVMs after hypoxia followed by normoxia periods as indicated.N = 3 per condition. *P = 0.03 in CCL2 group; *P = 0.04 in CCL3 group.
Data information: Data are expressed as mean ± SEM. One-way ANOVA with Bonferroni's multiple comparison test was used to compare groups. ns = non-significant.