
Figure 3. Pre-treatment with Ivermectin and Selamectin inhibits colon cancer stem cell self-renewal in clonogenic spheroid assays.
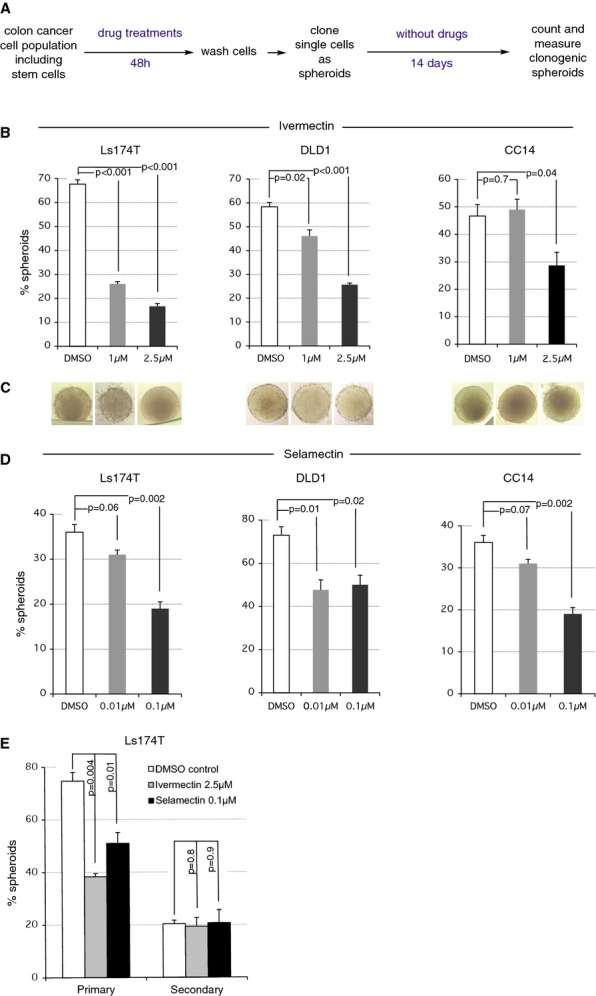
A Work flow for the pre-treatment and assessment of colon cancer stem cell self-renewal byin vitro clonogenic assays. Note that in this set-up, cells are treated before they are challenged to make floating clonogenic spheroids of human colon cancer cells (colon spheroids).
B–D (B,D) Histograms of the number of colon spheroids per 96-well plate, of DLD1 and Ls174T human colon cancer cell lines as well as of primary CC14 human colon cancer cells, after treatments with DMSO or different concentrations of Ivermectin (B) or Selamectin (D) as noted, following the scheme shown in (A). Columns show averages of triplicate experiments, with 3 plates per experiment. DMSO-treated cells are shown as controls. (C) Representative images of colon spheroids after 14 days (see A). Each panel corresponds to the treatment immediately above the image. Scale bar = 100 μM.
E Histograms of the number of Ls174T colon cancer cell spheroids obtained under the noted conditions from 2D drug-pretreated cells (primary cloning) and after a second clonogenic assay using as starting material the primary cloning spheroids.
Data information: Error bars = s.e.m. Probability (P) values are derived from two-tailedt-tests.