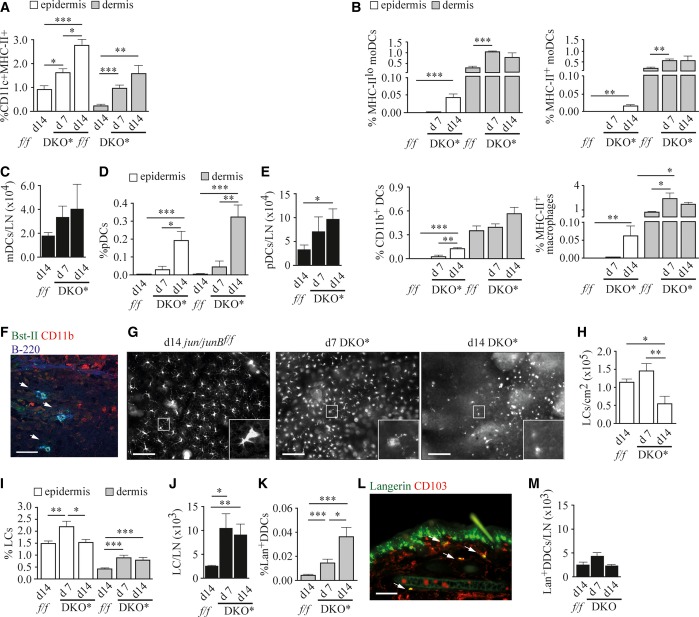
Figure 2. APC subtypes in inflamed skin of DKO* mice.
A, B Quantification of flow cytometric analysis of (A) ear epidermal and dermal APCs (n = 7–10), and (B) ear epidermal and dermal APCs after exclusion of LCs and Lan+ DDCs. Quantification of MHC-IIlo moDCs, MHC-II+ moDCs, CD11b+ DCs, and MHC-II+ macrophages (n = 3–4).
C Quantification of migratory DCs (CD11c+MHC-IIhi cells) in auricular lymph nodes (n = 5–7).
D, E Quantification of (D) ear epidermal and dermal pDCs (CD45+CD11c+Bst-II+B-220+CD11bneg cells) (n = 5–8), and (E) pDCs (CD45+CD11c+Bst-II+B-220+CD11bneg cells) in auricular lymph nodes (n = 6–9) of indicated mice 7–14 days after disease induction measured by flow cytometry.
F Histological ear section stained for Bst-II (green), CD11b (red), and B-220 (blue). Nuclear staining: Hoechst (brown). Arrows indicate double positive (Bst-II/B-220) cells. Scale bar indicates 50 μm.
G Representative images of epidermal ear sheets of indicated mice stained for Langerin. Scale bars indicate 100 μm.
H Epidermal LC numbers counted on ear sheets at the indicated time points. At least three randomly chosen fields were counted for each sample (n = 9–10).
I,J Quantification of (I) ear epidermal (CD45+Lan+ cells) and dermal (CD45+Lan+CD103neg cells) LCs (n = 8–20), and (J) LCs in auricular lymph nodes (Lan+CD8negCD11b+CD103neg) (n = 8–10).
K Quantification of ear dermal Lan+ DDCs (CD45+Lan+CD103+ cells) (n = 8–15) of indicated mice 7–14 days after disease induction measured by flow cytometry.
L Representative image of an immunofluorescent staining of an ear section of a day 14 DKO* mouse stained for Langerin (green) and CD103 (red). Arrows indicate double-positive cells, scale bar indicates 100 μm.
M Quantification of Lan+ DDCs (Langerin+CD8negCD11blo_to_+CD103+) in auricular lymph nodes of indicated mice (n = 8–10) by flow cytometry. Data information: Flow cytometric quantifications are depicted as percentage of live cells.
Data represent mean ± SEM. Data were analyzed using unpaired Student's t-test (*P < 0.05, **P < 0.01, ***P < 0.001). P-values for this figure are available in Supplementary Table S3.
Source data are available online for this figure.

