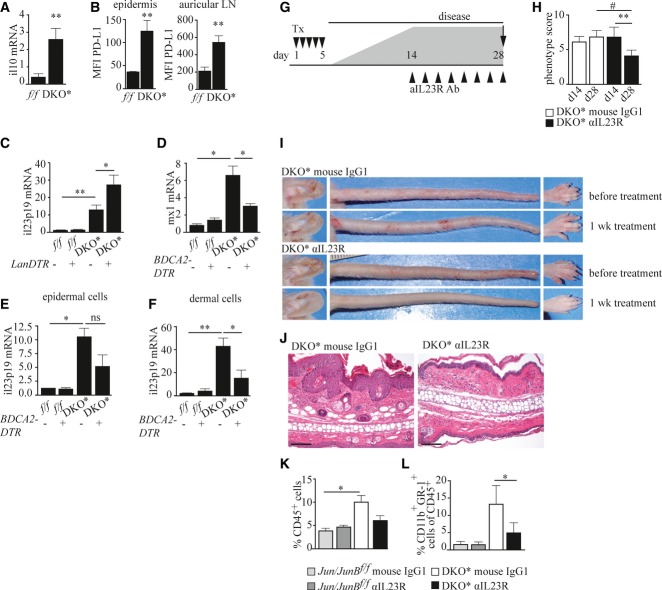
Figure 7. pDCs and LCs influence disease severity via IL-23.
A Relative Il10 mRNA expression in isolated LCs of indicated mice (n = 7–8).
B PD-L1 expression on epidermal and auricular lymph node LCs (n = 3).
C Relative Il23 mRNA expression in epidermal cells of indicated mice treated as described in Fig 4A (n = 4–6).
D Relative Mx1 mRNA expression (n = 3–7).
E, F Relative Il23 mRNA expression in (E) epidermal (n = 3–7) and (F) dermal cells (n = 3) of indicated mice treated as described in Fig 3A.
G Psoriatic disease was induced by five daily consecutive injections of Tx (▾), and on day 14, when psoriatic disease had developed, mice were treated with an inhibitory anti-IL-23R antibody or an isotype control every other day (▴), and euthanized on day 28.
H Psoriatic inflammation scored at day 14 and day 28 of the indicated mice (n = 9–14).
I Representative images of affected body parts of DKO* mice before and after treatment with anti-IL-23R or isotype control antibody.
J Representative H&E-stained ear sections of indicated mice on day 28. Scale bars represent 100 μm.
K, L Quantification of (K) dermal immune cells (CD45+) (n = 3–4), and (L) dermal monocytes/neutrophils (Gr-1+CD11bhi cells) within CD45+ dermal cells of indicated mice (n = 5–9) measured by flow cytometry.
Data information: Flow cytometric quantification in (K) is depicted as percentage of live cells. Data represent mean ± SEM. Data for (A–F) and (K) were analyzed using unpaired Student's t-test, and for (H) and (L), using Wilcoxon signed-rank test (*P < 0.05, **P < 0.01) and for (H), additionally using Mann–Whitney U-test (#P < 0.05). P-values for this figure are available in Supplementary Table S3.
Source data are available online for this figure.

