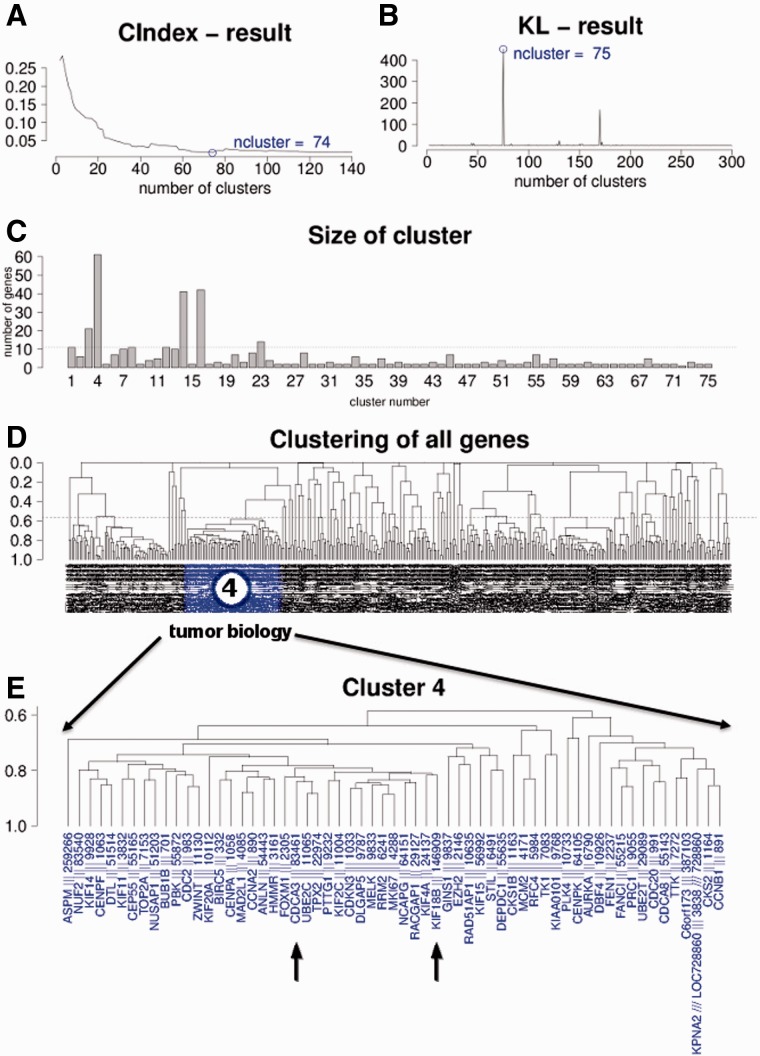
Fig. 2.
(A) C index analysis for good separation of clusters, indicating optimal separation for 74 clusters. (B) KL index analysis for good separation of clusters, indicating good separation for 75 clusters. (C) Plot of the number of genes in each of the 75 subclusters. (D) Unsupervised clustering of all 428 genes with correlation ≥ 0.8 over all 2158 datasets. (E) Enlargement of subcluster #4 containing 61 single genes

