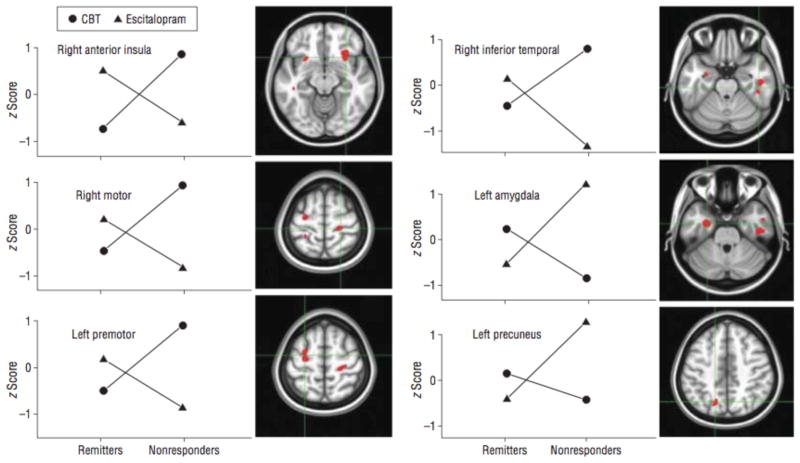
Figure 4. Treatment-Specific Biomarker Candidates for Treatment of Depression.
Mean regional activity values for remitters and nonresponders segregated by treatment (either Escitalopram given as escitalopram oxalate or cognitive behavioral therapy (CBT)) are plotted for the 6 regions showing a significant treatment × outcome analysis of variance interaction effect. Regional metabolic activity values are displayed as region/whole-brain metabolism converted to z scores. From McGrath et al., 2013b.

