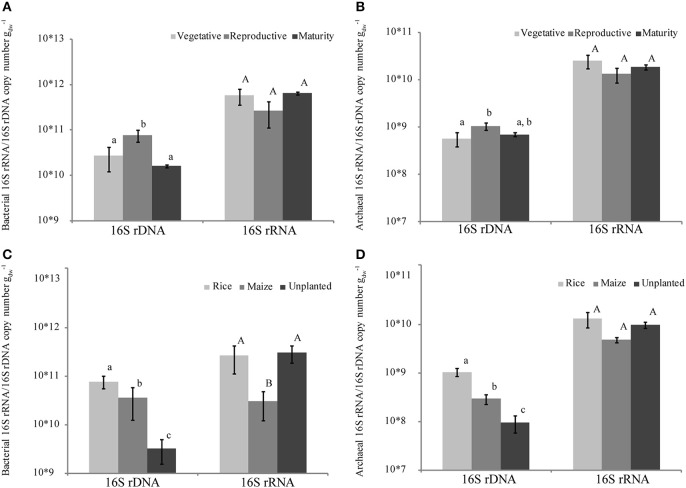
Figure 1.
Ribosomal 16S rDNA and rRNA copy numbers quantified using qPCR. Abundance of bacterial 16S rDNA and rRNA (A,C) and archaeal 16S rDNA and rRNA (B,D) in rice fields at different plant growth stages (A,B) as well as in fields planted with rice, maize or unplanted at the reproductive growth stage (C,D). Different letters indicate significant difference (mean ± SE, n = 9).

