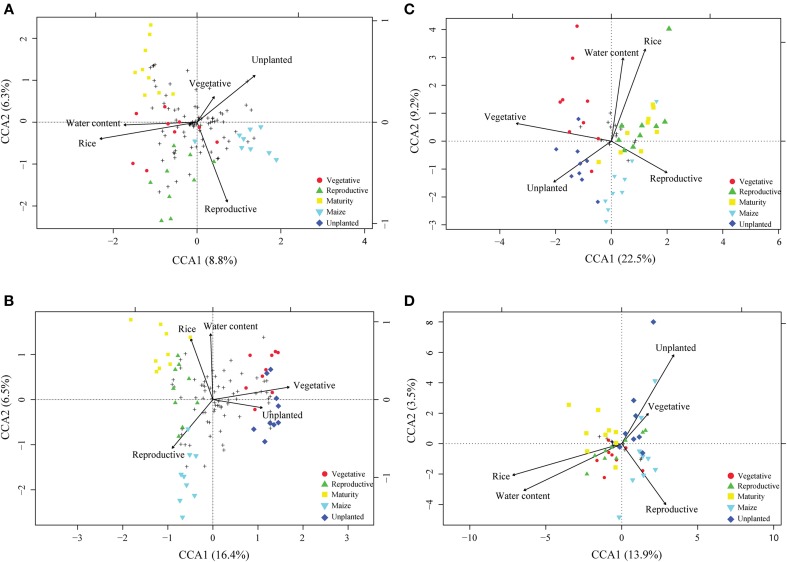
Figure 3.
Canonical correspondence analysis (CCA) biplot of T-RFLP based on bacterial and archaeal communities. T-RFLP based communities of bacterial 16S rDNA and rRNA (A,B) as well as archaeal 16S rDNA and rRNA (C,D) are displayed. Arrows indicate the direction and relative importance (arrow lengths) of environmental variables associated with bacterial and archaeal community structures, respectively. Solely the environmental variables significantly influencing the model were displayed (ANOVA p < 0.05). Circle, triangle and square symbols, respectively, represent vegetative, reproductive and maturity growth phase of rice. Inverted triangle and diamante symbols, respectively, characterize samples originating from maize and unplanted fields while crosses represent T-RFs.

