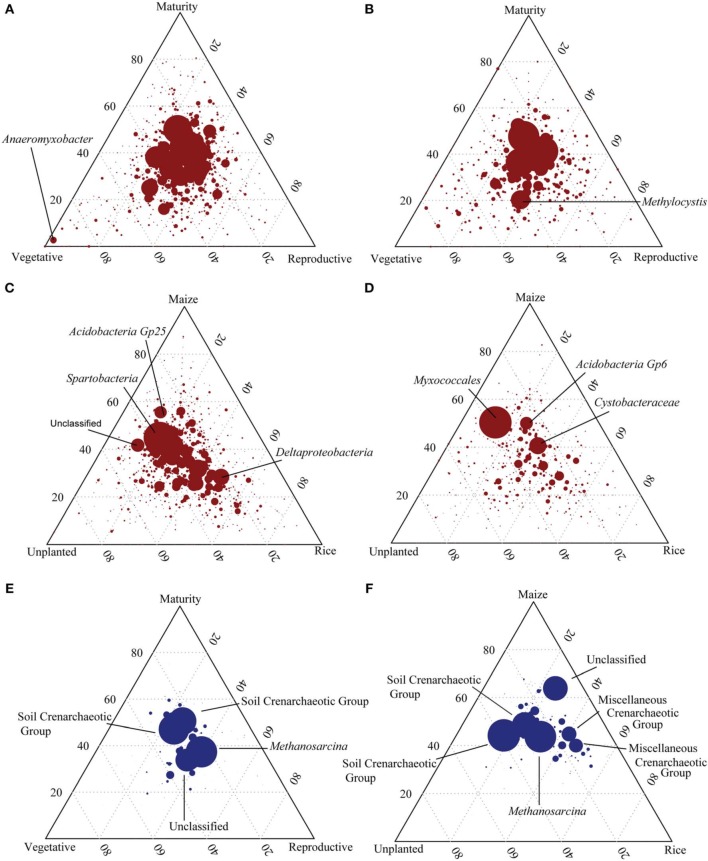
Figure 5.
Ternary plots showing the distribution of bacterial and archaeal 16S rDNA and rRNA based OTUs. Axes represent rice plant growth stages (vegetative, reproductive and maturity) (A,B,E) as well as unplanted and maize cultivated fields in comparison to rice cultivated fields (C,D,F) and the percentage of reads associated with each sample for each OTU. Bacterial 16S rDNA (red, A,C) and 16S rRNA (B,D) as well as archaeal 16S rDNA (blue, E,F) are displayed. Each circle represents an individual OTU while its size indicates number of reads associated. The position of each OTU is determined by the contribution of the sample type to the total count (n = 3).

