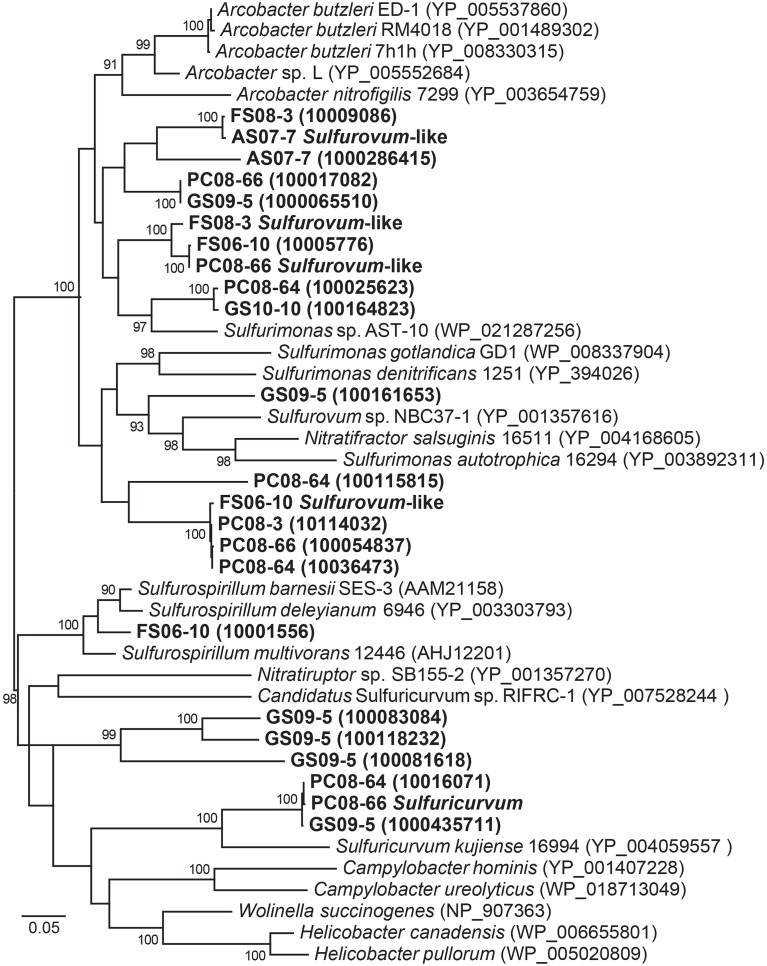
Figure 3.
Maximum likelihood phylogeny of NapA sequences affiliated with Epsilonproteobacteria from all the metagenomes and sequences mined from complete and draft genomes available from NCBI and IMG/M. Accession numbers or IMG designations are given in parentheses. Bootstrap support values >90 based on 1000 bootstrap samplings are shown for each node.

