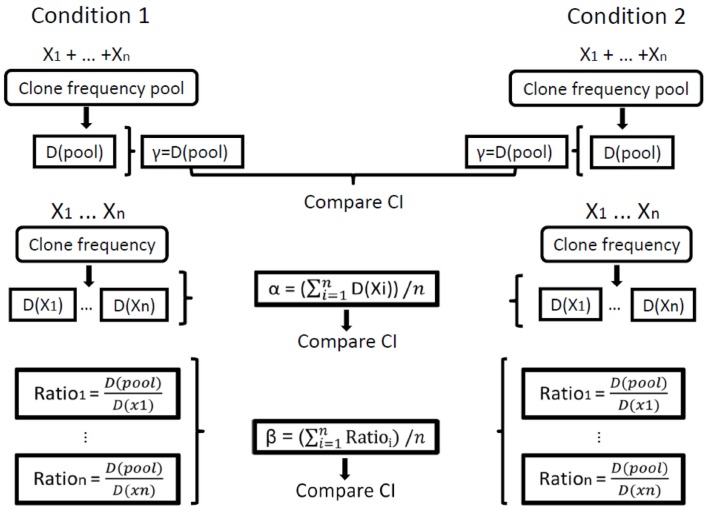
Figure 1.
Illustration of the calculation of repertoire diversity. First, the diversity indices (Shannon entropy, Simpson concentration, etc.) are calculated for each sample. Next, the distribution measures (α, β, γ) are calculated for each condition using the individual samples. Finally, the confidence intervals (CI) of the distribution measures are compared between the populations/conditions. Xi represents the set of clone frequencies in sample i, that is, the set (for all samples) of the numbers of unique sequences in all clones in sample i out of the total number of unique sequences in the whole sample. D stands for Diversity, D(pool) is the calculation of γ (gamma) for a sample and D(Xi) is the calculation of α (alpha) for sample i. In our calculations of order 1, we used only the Shannon entropy for D, and for order 2 we used only the Simpson concentration for D.

