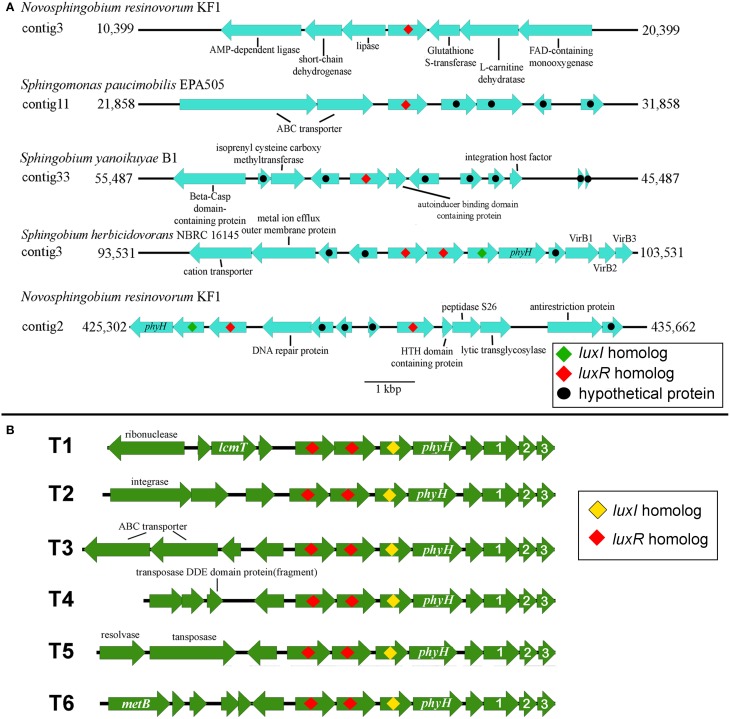
Figure 5.
Gene organization of luxR Solos and luxR-luxR-luxI in the four whole genome sequenced sphingomonads. (A) EasyFig generated linear comparison of luxR solos in the genomic region of selected sphingomonads. Approximately 5000 bp of genomic region flanking the luxR solos is shown. (B) Gene orientation of the identified convergent double luxR, luxI group and its gene neighborhood variation. T1 to T6 denotes different gene neighborhoods identified in the convergent double luxR, luxI. Arrows without label represent gene coding for hypothetical protein. Please see Table 2 for topology variation present in sphingomonad genomes. The numbers “1,” “2,” and “3” represent virB1, virB2, and virB3 genes respectively. Additional abbreviations include: lcmT, Isoprenylcysteine carboxyl methyltransferase; metB, Cystathionine gamma-synthase; phyH, phytanoly dioxygenase.

