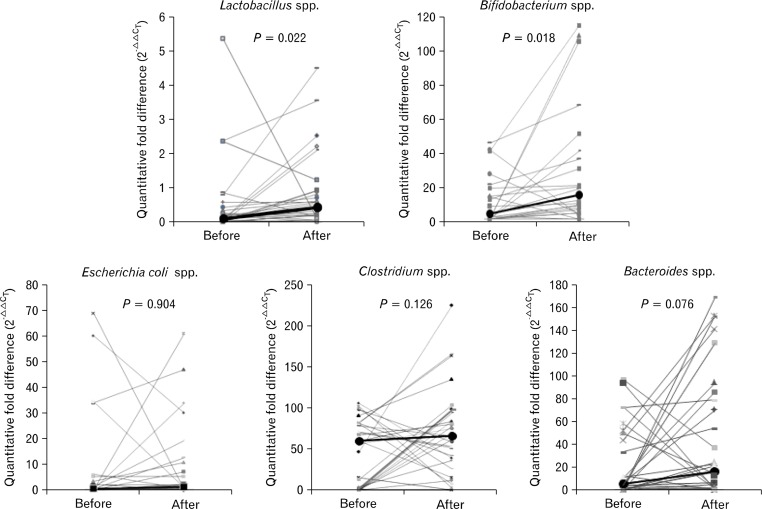
Figure 2.
Fold differences in each bacterial gene expression were calculated using the formula 2−ΔΔCT and represented as relative expression after normalization to pre-treated group. In healthy controls, fold differences of Lactobacillus, Bifidobacterium and Bacteroides species increased after VSL#3 ingestion compared to before ingestion (P = 0.022, P = 0.018, and P = 0.076, respectively; Wilcoxon signed-rank test). Bold line shows the median value of each group.

