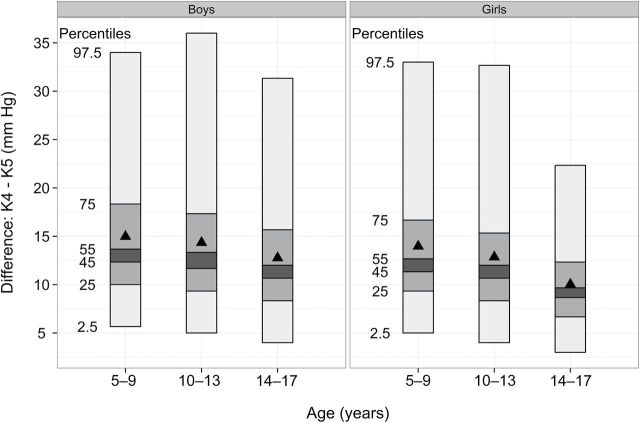
Figure 1.
Percentile plots of the fourth Korotoff phase (K4) and fifth Korotkoff phase (K5) difference by sex and age group. Each bar includes the middle 95% (2.5th percentile to 97.5th percentile) of the distribution, and the horizontal lines represent various percentiles. The dark triangle represents the mean difference. Boys are on the left; girls are on the right.

