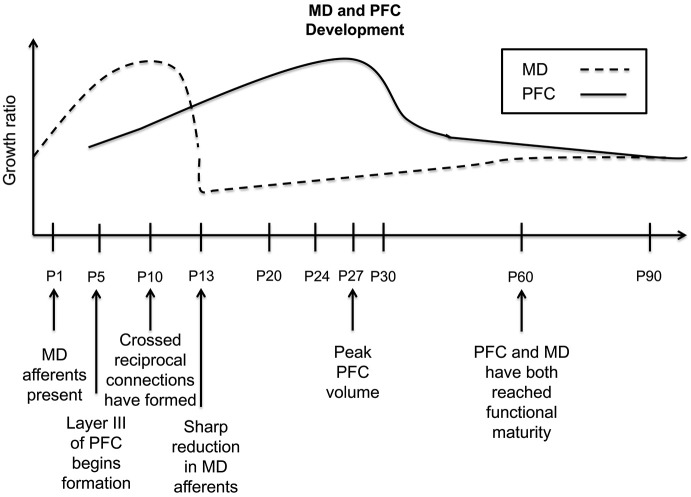
Figure 1.
Timeline of the developmental trajectory of MD afferent density and PFC volume in the rodent PFC. Dashed black line—MD afferent density to the PFC, solid black line—PFC volume. MD afferent arrival precedes the differentiation and lamination of layer III; the density of this projection increases through P10, then decreases sharply at P13, and stabilizes by P60. PFC volume begins increasing at P5, reaching its peak around P27, dropping rapidly around P30, and then decreasing gradually until P90. Given that the PFC volumetric changes follow closely behind the density dynamics of inputs from the MD, this may suggest a regulatory relationship of MD innervation on PFC development. This summary graph is based on the previous publications (Van Eden and Uylings, 1985; Van Eden, 1986; Rios and Villalobos, 2004).

