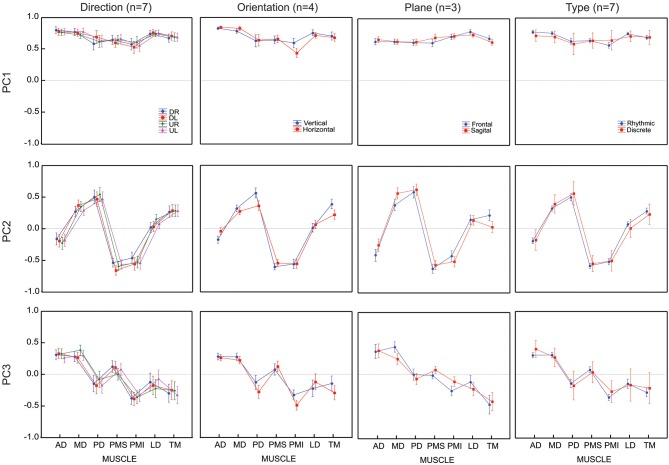
Figure 4.
Average loadings for each PC (un-rotated principal component analyses) and for 4 movement conditions (4 movement directions, 2 movement orientations, 2 movement planes and 2 movement types). Movement conditions are displayed in columns. Each PC is displayed in rows. Each graph presents the average loadings for each muscle for each PC and each condition (identified by color and symbols).

