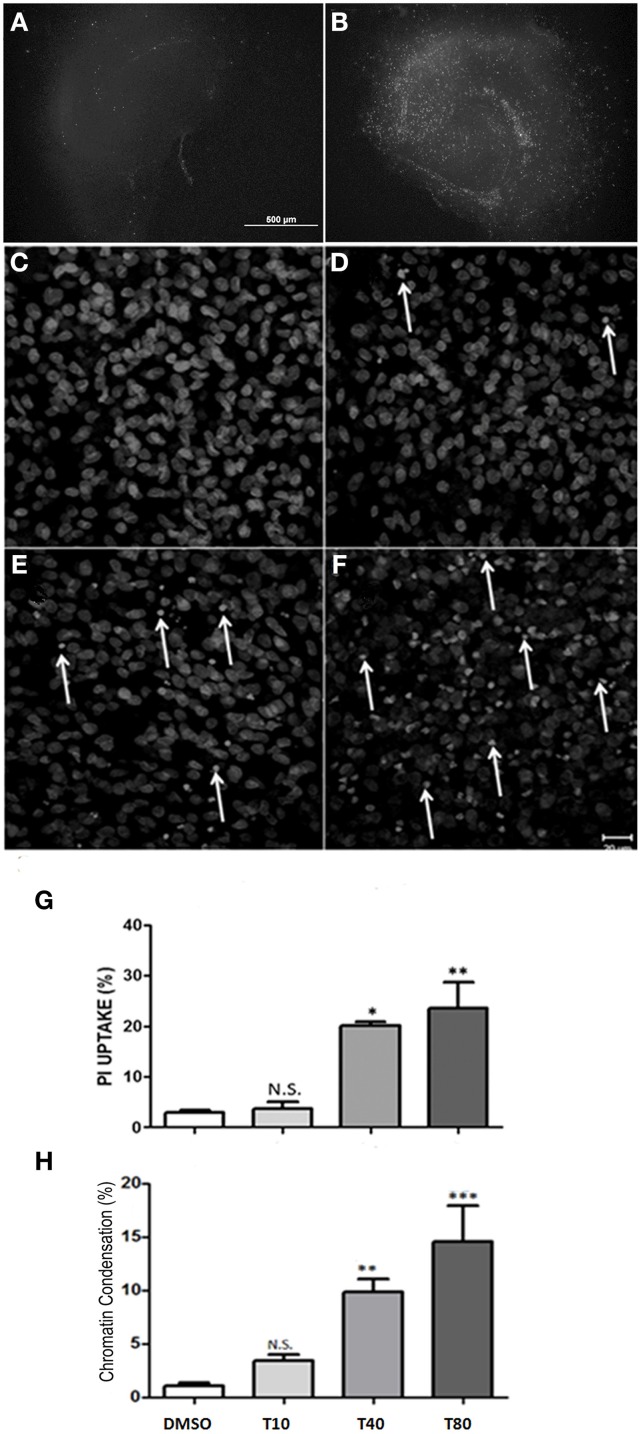
Figure 2.
Tunicamycin induces necrosis and apoptosis in hippocampal slices in a dose-dependent way. Representative photomicrographies at 4x magnification shows propidium iodide (PI) uptake following 24 h of Tunicamycin treatment at 80 μg/mL. (A) DMSO, (B) Tunicamycin at 80 μg/mL; scale bar: 500 μm. (C–F) Photomicrographies of fixed slices stained with nuclear marker TO-PRO3 following Tunicamycin treatment at 10 (D), 40 (E) and 80 μg/mL (F) for 24 h at 40x magnification compared to control (C). Arrows point nuclei with apoptotic morphology. (G) Quantification of PI fluorescence percentage relative to maximum fluorescence intensity values of each different dose compared to control. Values represent ± S.E.M. compared to vehicle. One-Way ANOVA was performed followed by Bonferroni's post test. C.I.: 95%; p < 0.05; N = 3 independent experiments. (H) Quantification of chromatin condensation in treated slices compared to vehicles *p < 0.1; **p < 0.05; ***p < 0.0001. P < 0.01, C.I.: 99%, N = 4 independent experiments.

