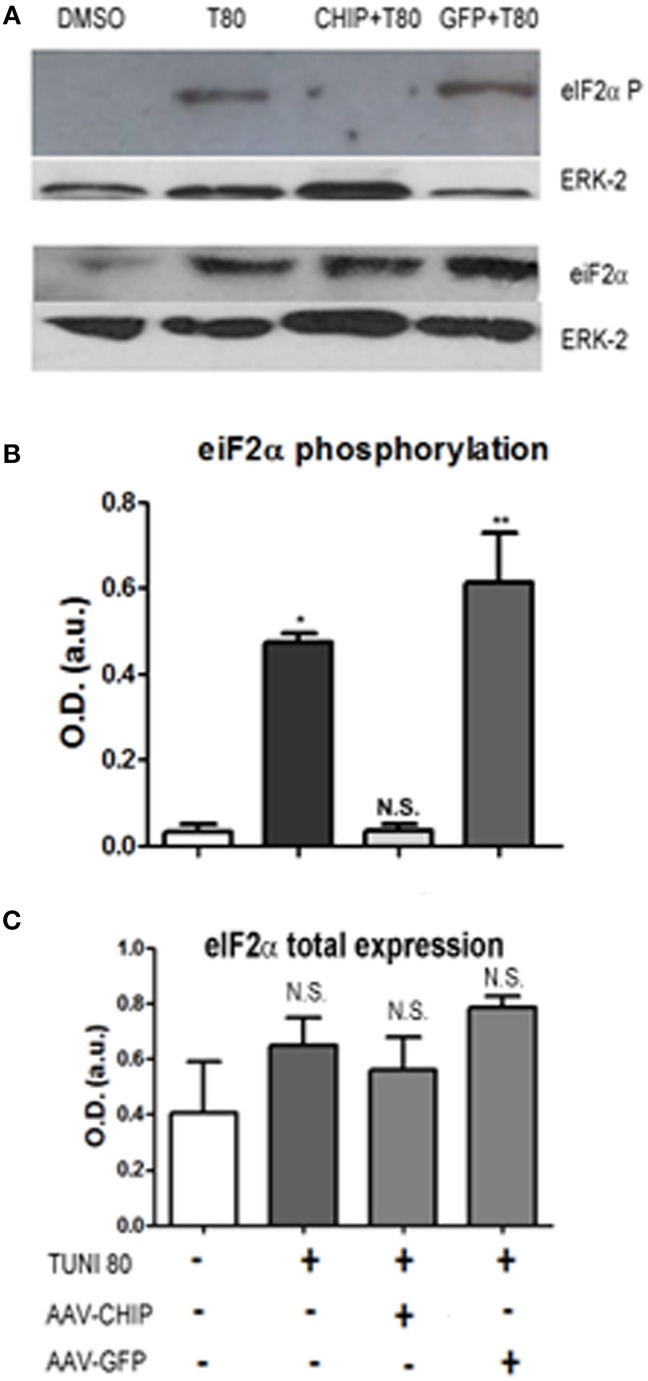
Figure 6.
Overexpression of CHIP reduces eIF2-α phosphorylation after Tunicamycin treatment. Western Blot (A) for phosphorylated eIF2-α (upper) and total eIF2-α expression (down) comparing vehicles (DMSO) to treated/infected slices. ERK-2 was used as a loading control. (B,C) Quantification for optical density (O.D) *p < 0.1, **p < 0.05. Values represent ± S.E.M. compared to vehicles. P < 0.1, C.I.: 90%, N = 3 independent experiments.

