Figure 7.
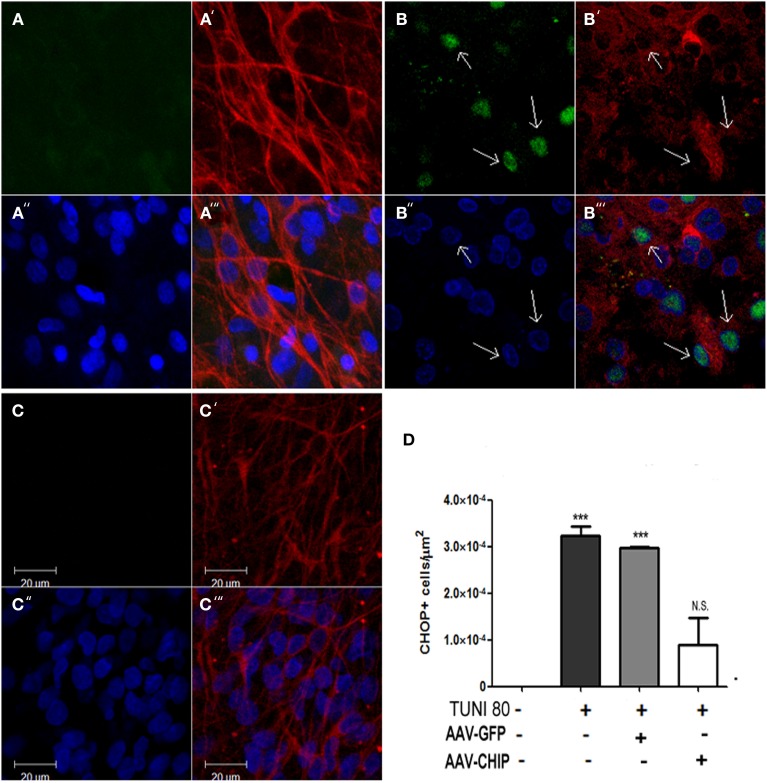
Overexpression of CHIP diminishes CHOP/GADD153 positive neurons after Tunicamycin treatment. Immunofluorescence for CHOP (green) and TUJ-1 (red) counterstained with nuclear marker TO-PRO3 (in blue). (A–A″′) Vehicle treated slice. (B-B″′) Tunicamycin treated slice. (C-C″′) rAAV8-CHIP + Tunicamycin treated slice. 63x Magnification, scale bar: 20 μm. Arrows point CHOP+ neurons in CA1 region. (D). Quantitative analysis of CHOP/GADD153 + cells/area ***p < 0.0001. Values represent ± S.E.M. compared to vehicles. P < 0.01, C.I.: 99.9%, N = 3 independent experiments.

