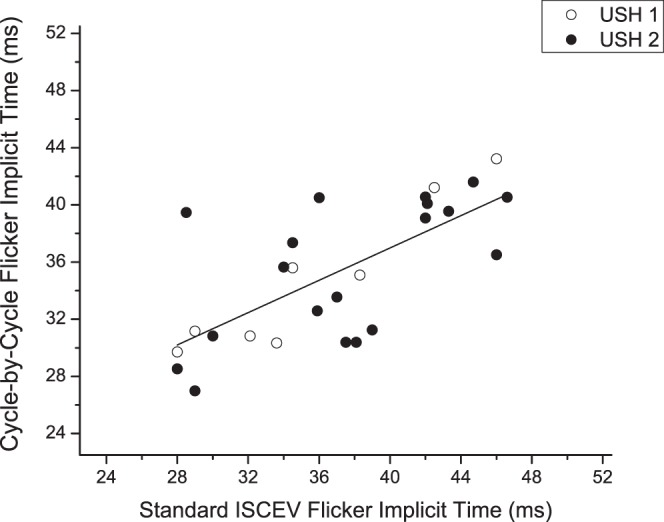
Figure 4.

Scatterplot showing the implicit time values of the flicker response fundamental component obtained with CxC recordings in both USH1 and USH2 patients plotted as a function of the corresponding values obtained with ISCEV standard ERG. Dashed line depicts 1:1 timing.
