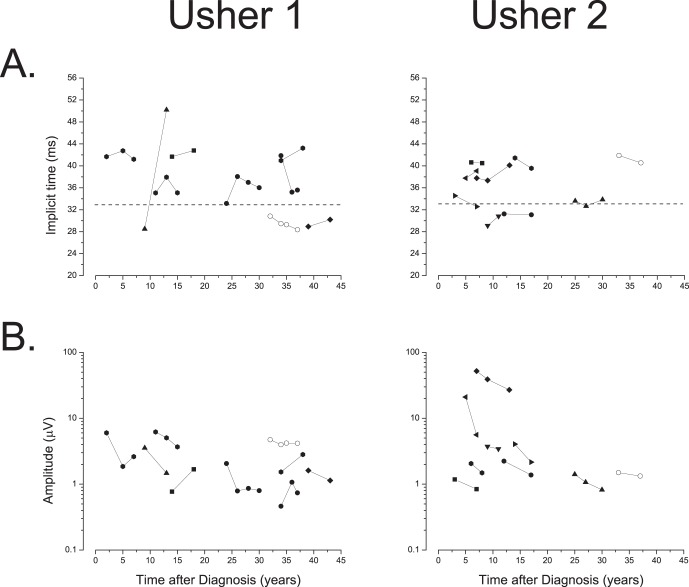
Figure 5.
(A) Longitudinal flicker ERG response latency timing of USH1 and USH2 patients. Values were calculated from the phase measurements (phase degrees/360 × 31.25 msec) and bracketing the resulting values between 20 and 54. The horizontal dashed lines in the plots denote the normal 95% confidence limits for implicit time values. (B) Longitudinal ERG amplitude. Individual log ERG amplitude values plotted as a function of time after diagnosis for USH1 and USH2.

