
Figure 6.
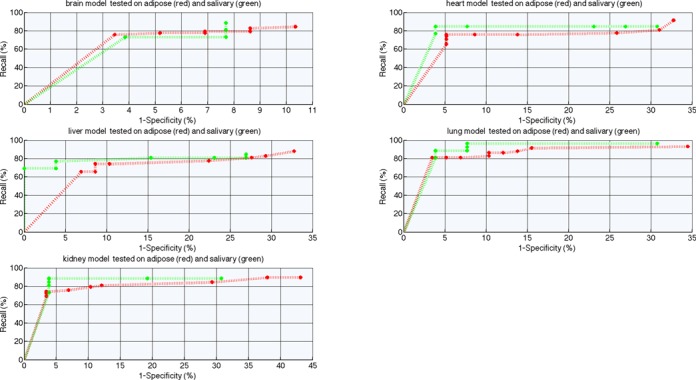
ROC performance curve for ensemble models trained on FANTOM5 tissue-specific data and tested on independent data coming from adipose and salivary.
Official websites use .gov
A
.gov website belongs to an official
government organization in the United States.
Secure .gov websites use HTTPS
A lock (
) or https:// means you've safely
connected to the .gov website. Share sensitive
information only on official, secure websites.
ROC performance curve for ensemble models trained on FANTOM5 tissue-specific data and tested on independent data coming from adipose and salivary.