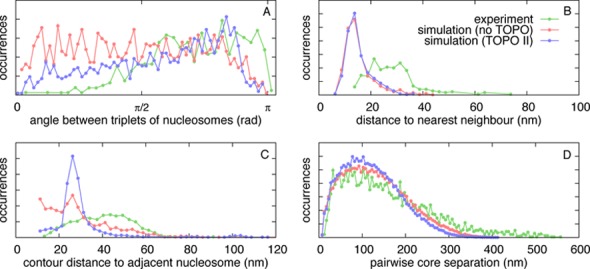
Figure 7.

Comparing with experimental measurements extracted from AFM images. Data from (39) is compared with measurements from simulated configurations which have been flattened onto a plane. Simulations were from a 22.1 kbp DNA molecule, using the ΔLk = −1.0 model nucleosomes, for the cases without and with topoisomerase II action, as described in the text. The experiments involved reconstitution of chromatin using DNA molecules with 601 positioning elements separated by linker DNA of length 60 bp (20.4 nm); we compare with the simulations where nucleosome cores were regularly pre-positioned such that the expected linker length is 73 bp (24.8 nm). (A) Distribution of the angle between consecutive triplets of nucleosomes. Experimental data are from Figure 3–13C in (39), which actually show a combination of angle between triplets of nucleosome and the angle between the entry-exit DNA strands where this was clearly visible. (B) Distribution of the straight-line 2D distance between a nucleosome and its nearest neighbour (in 2D, not necessarily one of its neighbours along the fibre). Experimental data are extracted from the AFM image in Figure 3–16A in (39) (reproduced here in Supplementary Figure S4A). (C) Distribution of the contour distance (i.e. along the DNA path) between consecutive nucleosomes along the fibre. Experimental data are from Figure 3–12C in (39); where the DNA is not visible on the AFM image the nucleosome centre–centre distance is used instead. (D) Distribution of the separation of each pair of nucleosomes within a chromatin fibre. Experimental data are extracted from the AFM image in Figure 3–16A in (39) (reproduced here in Supplementary Figure S4A).
