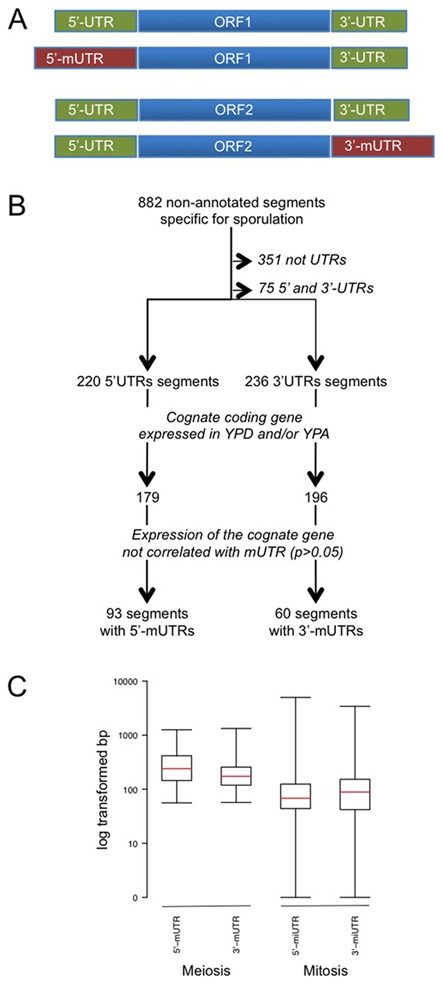
Figure 1.

Definition, identification and characterization of mUTRs. (A) The schematic shows two prototype genes (ORF1 and ORF2 shown in blue, UTRs shown in green) encoding transcript isoforms with extended 5′-meiotic UTRs (5′-mUTRs) or 3′-meiotic UTRs (3′-mUTRs), respectively (shown in red). (B) A flow chart depicts the key steps of the mUTR annotation procedure and its output. (C) UTR length distribution in mitosis and meiosis. A box plot shows the size distribution in log-transformed lengths (in bp; y-axis) for 5′-UTRs and 3′-UTRs during meiosis and mitosis (x-axis). The red line is the median.
