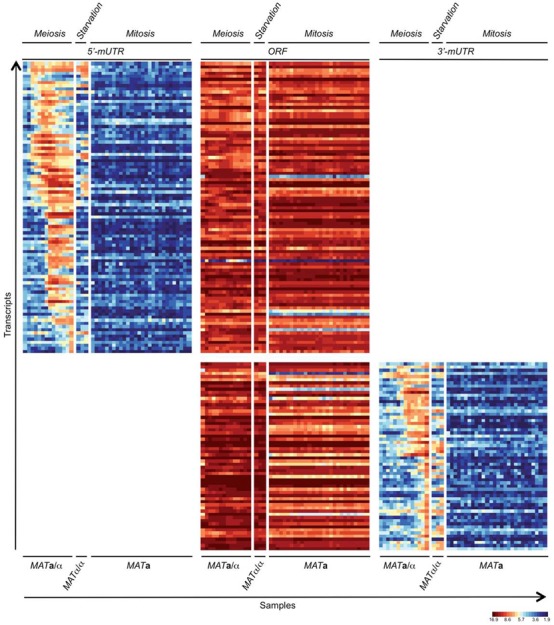
Figure 2.

Transcript isoform expression during mitosis, meiosis and starvation. A false-colour heatmap is shown for transcript 5′-mUTRs (left column), ORFs (middle column) and 3′-mUTRs (right column). Samples from haploid (MATa), diploid (MATa/α) and diploid sporulation-deficient (MATα/α) strains are indicated at the bottom. MATa/α cells were harvested in YPD, YPA and SPII 1–12 (hourly time points; Meiosis). MATα/α samples were from cells cultured in YPA, SPII 8 and 10 h (Starvation). MATa cells were sampled every 5 min following α-factor synchronization between 0 and 135 min (Mitosis). Each line on the y-axis corresponds to a transcript and each column on the x-axis represents a set of samples as indicated. A colour scale for normalized and log2-transformed expression signals is given.
